
Steamboat Geyser eruption history.
Detailed Description
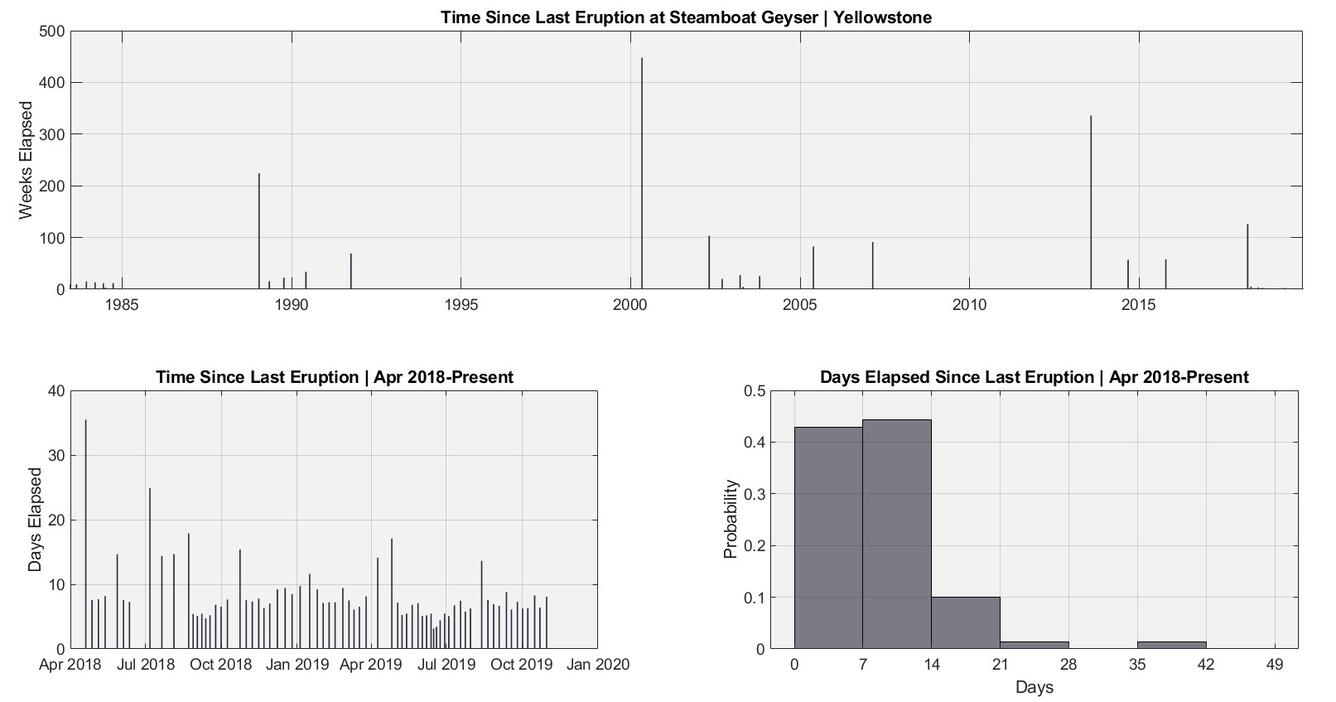
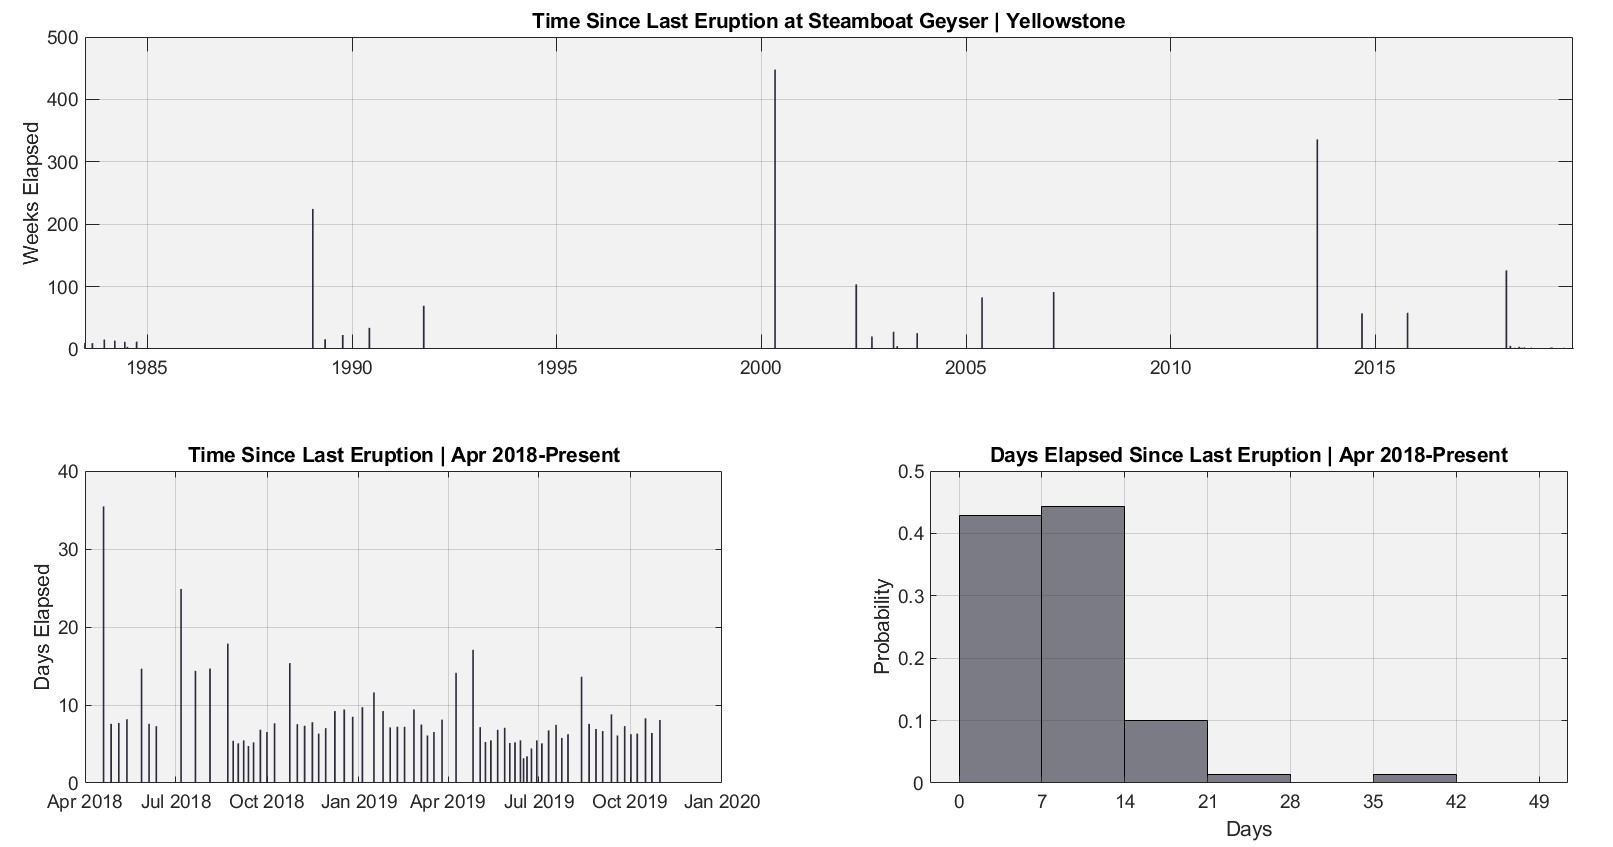
Steamboat Geyser eruption history. Top: Each stem indicates an eruption that corresponds to a date along the x-axis. The y-axis illustrates the number of weeks that pass between each eruption. Bottom-left: The number of days that pass between eruptions that have occurred in its most recent active phase. Bottom-right: histogram displaying the distribution of the time elapsed between eruptions during the recent active phase. Plots by Moyosore Ajayi of Vanderbilt University based on data from geysertimes.org.
Sources/Usage
Public Domain.