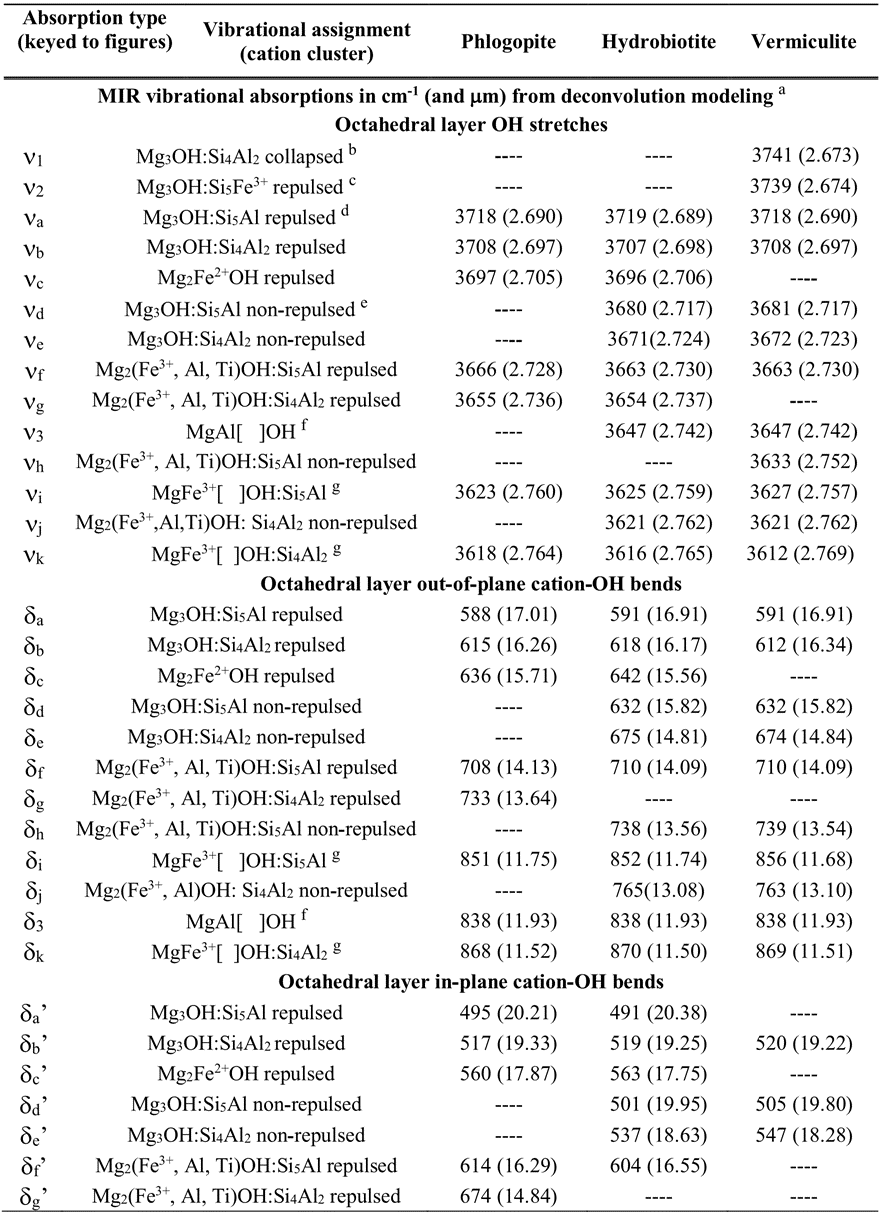
Summary of OH-related mid-infrared (MIR) spectral features.

Detailed Description
Table 5. Summary of OH-related mid-infrared (MIR) spectral features of unexpanded and expanded vermiculite ores.
Notes: Vibrational positions from spectra of handpicked, ground mica flakes from the unexpanded GDS469 ore sample from Libby, MT; the unexpanded ALB5SA00 ore sample from Palabora, S. Africa; and the expanded vermiculite ores as noted. Vibrational assignments from Beran et al. (2002), Besson and Drits (1997), Farmer et al. (1971), Fechtelkord et al. (2003), Jenkins (1989), Papin et al. (1997), Serratosa et al. (1970), Vedder and Wilkins (1969), Wunder and Melzer (2002), and this study. va = OH stretch, δa = out-of-plane cation-OH bend, and δa’ = in-plane cation-OH bend fundamental absorptions. [ ] = vacant octahedral cation site. ---- = absorption not observed. v1 and v3 absorptions observed in spectra of expanded vermiculite ore caused by heating (see Fig. 15b); v2 = absorption observed in unexpanded ore ALB5SA00 (see Fig. 15a), which has 37% of its Fe as Fe3+ in tetrahedral sites according to electron probe microanalysis and Mössbauer analysis.
a Wavelength positions of absorptions based on Gaussian-Lorentizian area (fixed shape, variable width) deconvolution using Peakfit® v4.12.
b Collapsed = increased dehydration-induced repulsion of hydroxyl hydrogen by adjacent interlayer divalent cations that were water-coordinated prior to heating-induced expansion of vermiculite ore.
c Higher frequency shift of absorption likely due to Fe3+ in tetrahedral layer.
d Repulsed = repulsion of hydroxyl hydrogen by positive charge of adjacent interlayer cations.
e Non-repulsed = no repulsion of hydroxyl hydrogen due to lack of adjacent interlayer cations.
f Assignment based on presence of this absorption in spectra of the expanded vermiculite ore samples ALB22SC00, South Carolina; GDS847, Louisa, Virginia; and GDS909, Libby, Montana (Figs. 15b and 19); and in the spectrum of an unexpanded Mg-vermiculite VTx-1 sample from Llano, Texas (see appendix discussion and Fig. A6).
g Assigned to MgFe3+[ ]OH vacancy cation clusters based on the absence of these absorptions in the Mg- and Al-rich, Fe-poor Llano, Texas, vermiculite sample (see appendix discussion and Fig. A6).
Sources/Usage
Public Domain.
Characterizing the source of potentially asbestos-bearing commercial vermiculite insulation using in situ IR spectroscopy
Swayze, G.A., Lowers, H.A., Benzel, W.M., Clark, R.N., Driscoll, R.L., Perlman, Z.S., Hoefen, T.M., and Dyar, M.D., 2018, American Mineralogist, v. 103, p. 517-549.
https://doi.org/10.2138/am-2018-6022
Abstract:
Commercially produced vermiculite insulation from Libby, Montana, contains trace
levels of asbestiform amphibole, which is known to cause asbestos-related diseases. When
vermiculite insulation is found in a building, evaluation for its potential asbestos content
traditionally involves collecting a sample from an attic or wall and submitting it for potentially
time-consuming analyses at an off-site laboratory. The goal of this study was to determine if in
situ near-infrared reflectance measurements could be used to reliably identify the source of
vermiculite ore and therefore its potential to contain asbestos. Spectra of 52 expanded ore
samples, including attic insulation, commercial packing materials, and horticultural products
from Libby, Montana; Louisa, Virginia; Enoree, South Carolina; Palabora, South Africa; and
Jiangsu, China, were measured with a portable spectrometer. The mine sources for these
vermiculite ores were identified based on collection location, when known, and on differences in
elemental composition as measured by electron probe microanalysis. Reflectance spectra of the
insulation samples show vibrational overtone and combination absorptions that vary in
wavelength position and relative intensity depending on elemental composition and proportions
of their constituent micas (i.e., vermiculite ore usually consists of a mixture of hydrobiotite and
vermiculite mineral flakes). Band depth ratios of the 1.38/2.32-, 1.40/1.42-, and 2.24/2.38-µm
absorptions allow determination of a vermiculite insulation’s source and detection of its potential
to contain amphibole, talc, and/or serpentine impurities. Spectroscopy cannot distinguish
asbestiform vs non-asbestiform amphiboles. However, if the spectrally determined mica
composition and mineralogy of an insulation sample is consistent with ore from Libby, then it is
likely that some portion of the sodic-calcic amphibole it contains is asbestiform, given that all of
the nearly two dozen Libby vermiculite insulation samples examined with scanning electron
microscopy in this study contain amphiboles. One sample of expanded vermiculite ore from
multiple sources was recognized as a limitation of the spectral method, therefore an additional
test (i.e., 2.24-µm absorption position vs 2.24/2.38-µm band depth) was incorporated into the
spectral method to eliminate misclassification caused by such mixtures. With portable field
spectrometers, the methodology developed can be used to determine vermiculite insulation’s
source and estimate its potential amphibole content, thereby providing low-cost analysis with
onsite reporting to property owners.

