
Temporal Trends in U.S. Groundwater Levels Based on Wells and GRACE-DADM Storage, 2001–2020

Detailed Description
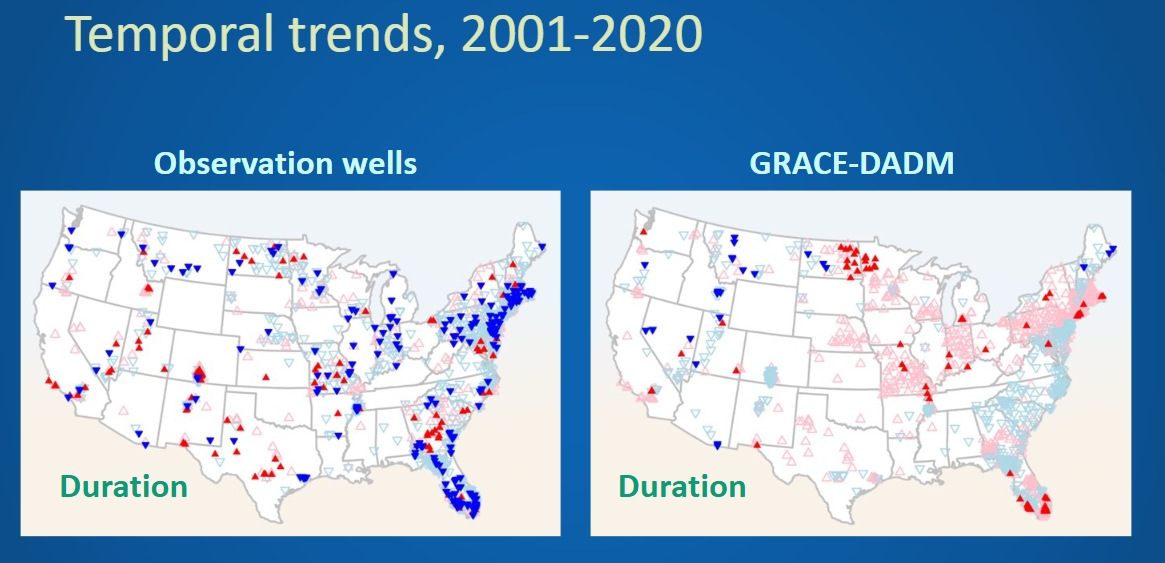
This figure shows groundwater-drought trends from 2001 to 2020 based on analysis of groundwater-level data in wells and groundwater storage from Gravity Recovery and Climate Experiment Drought Monitor Data Assimilation (GRACE-DADM) data. For annual groundwater duration below the 10% low long-term threshold, blue symbols represent decreased numbers of drought days (wetter conditions) and red symbols represent increased numbers (drier conditions). Solid triangles represent statistically significant trends while open triangles represent insignificant ones for all metrics.
This figure comes from a USGS groundwater study that assessed groundwater drought trends over space and time that was published in the Journal of Hydrology in 2026.
Sources/Usage
Public Domain.