
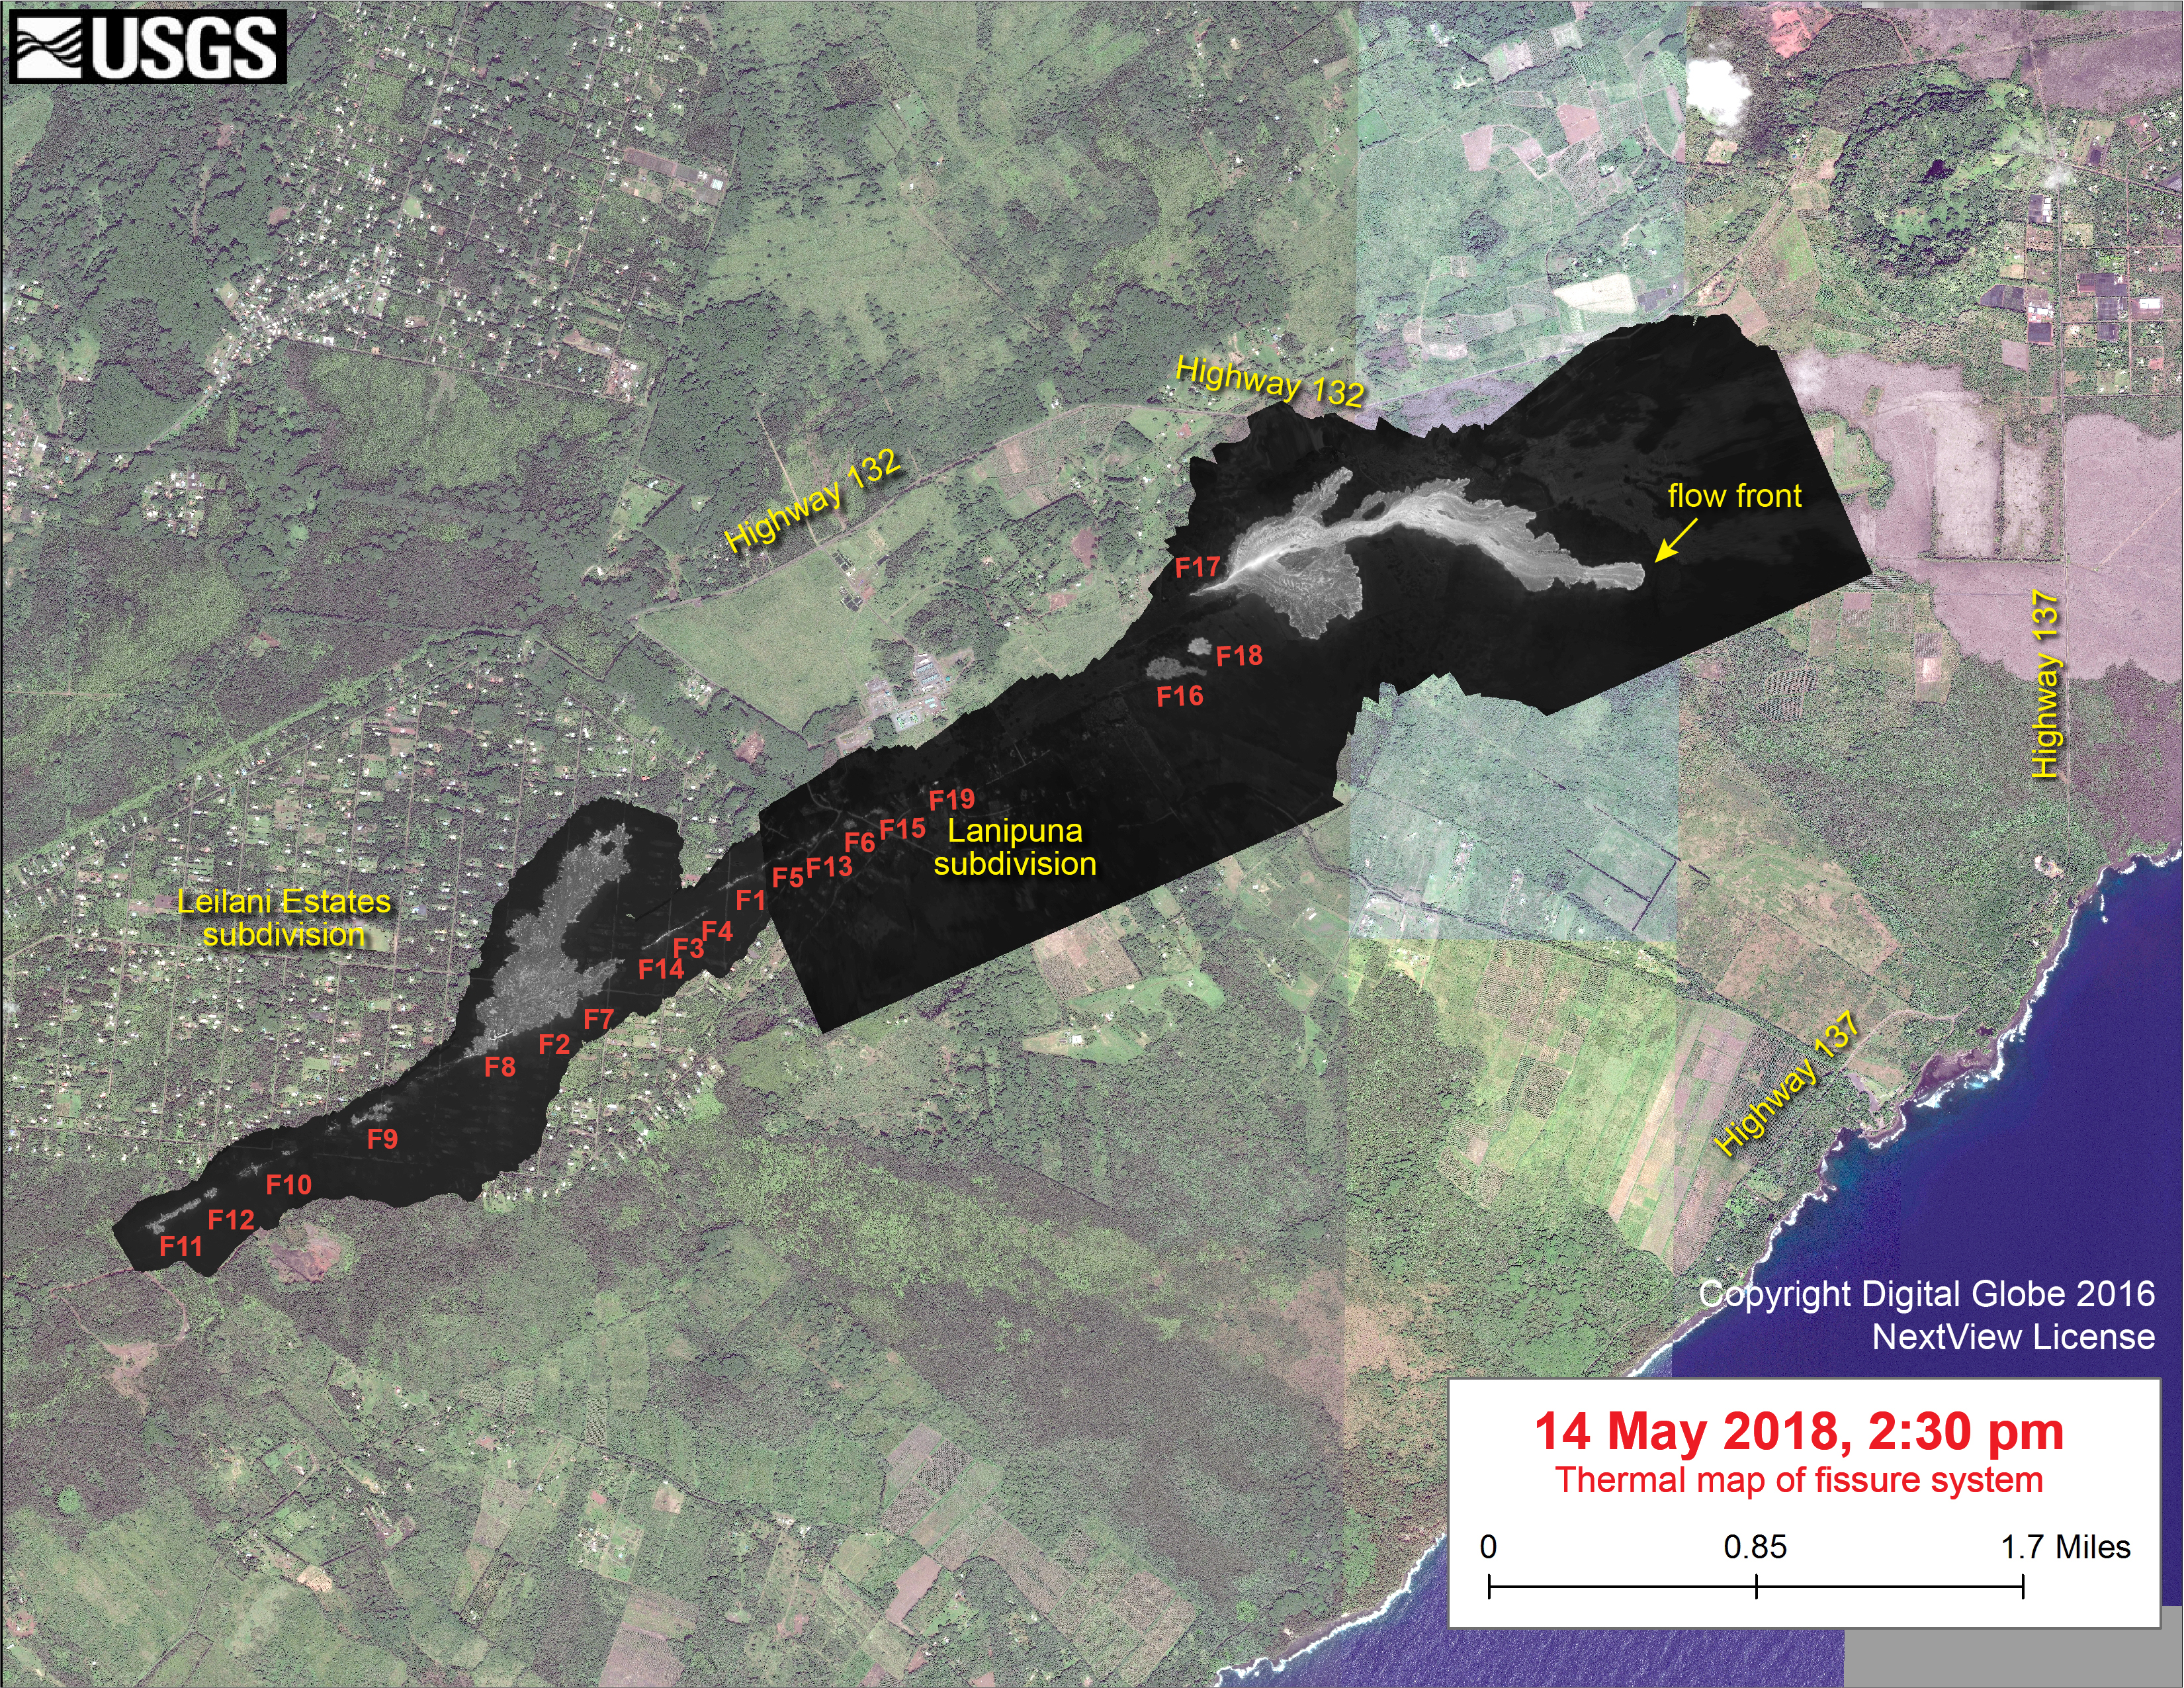
Thermal map of the fissure system

Detailed Description
This thermal map shows the fissure system during an overflight of the area this afternoon (the western part of the thermal map, in Leilani Estates, was based on a May 9 overflight, and fissure activity in that region has not changed since that time). Fissure 17 was producing a lava flow extending about 1.7 km (1.1 miles) from the fissure. The black and white area is the extent of the thermal map. Temperature in the thermal image is displayed as gray-scale values, with the brightest pixels indicating the hottest areas. The thermal map was constructed by stitching many overlapping oblique thermal images collected by a handheld thermal camera during a helicopter overflight of the flow field. The base is a copyrighted color satellite image (used with permission) provided by Digital Globe.