
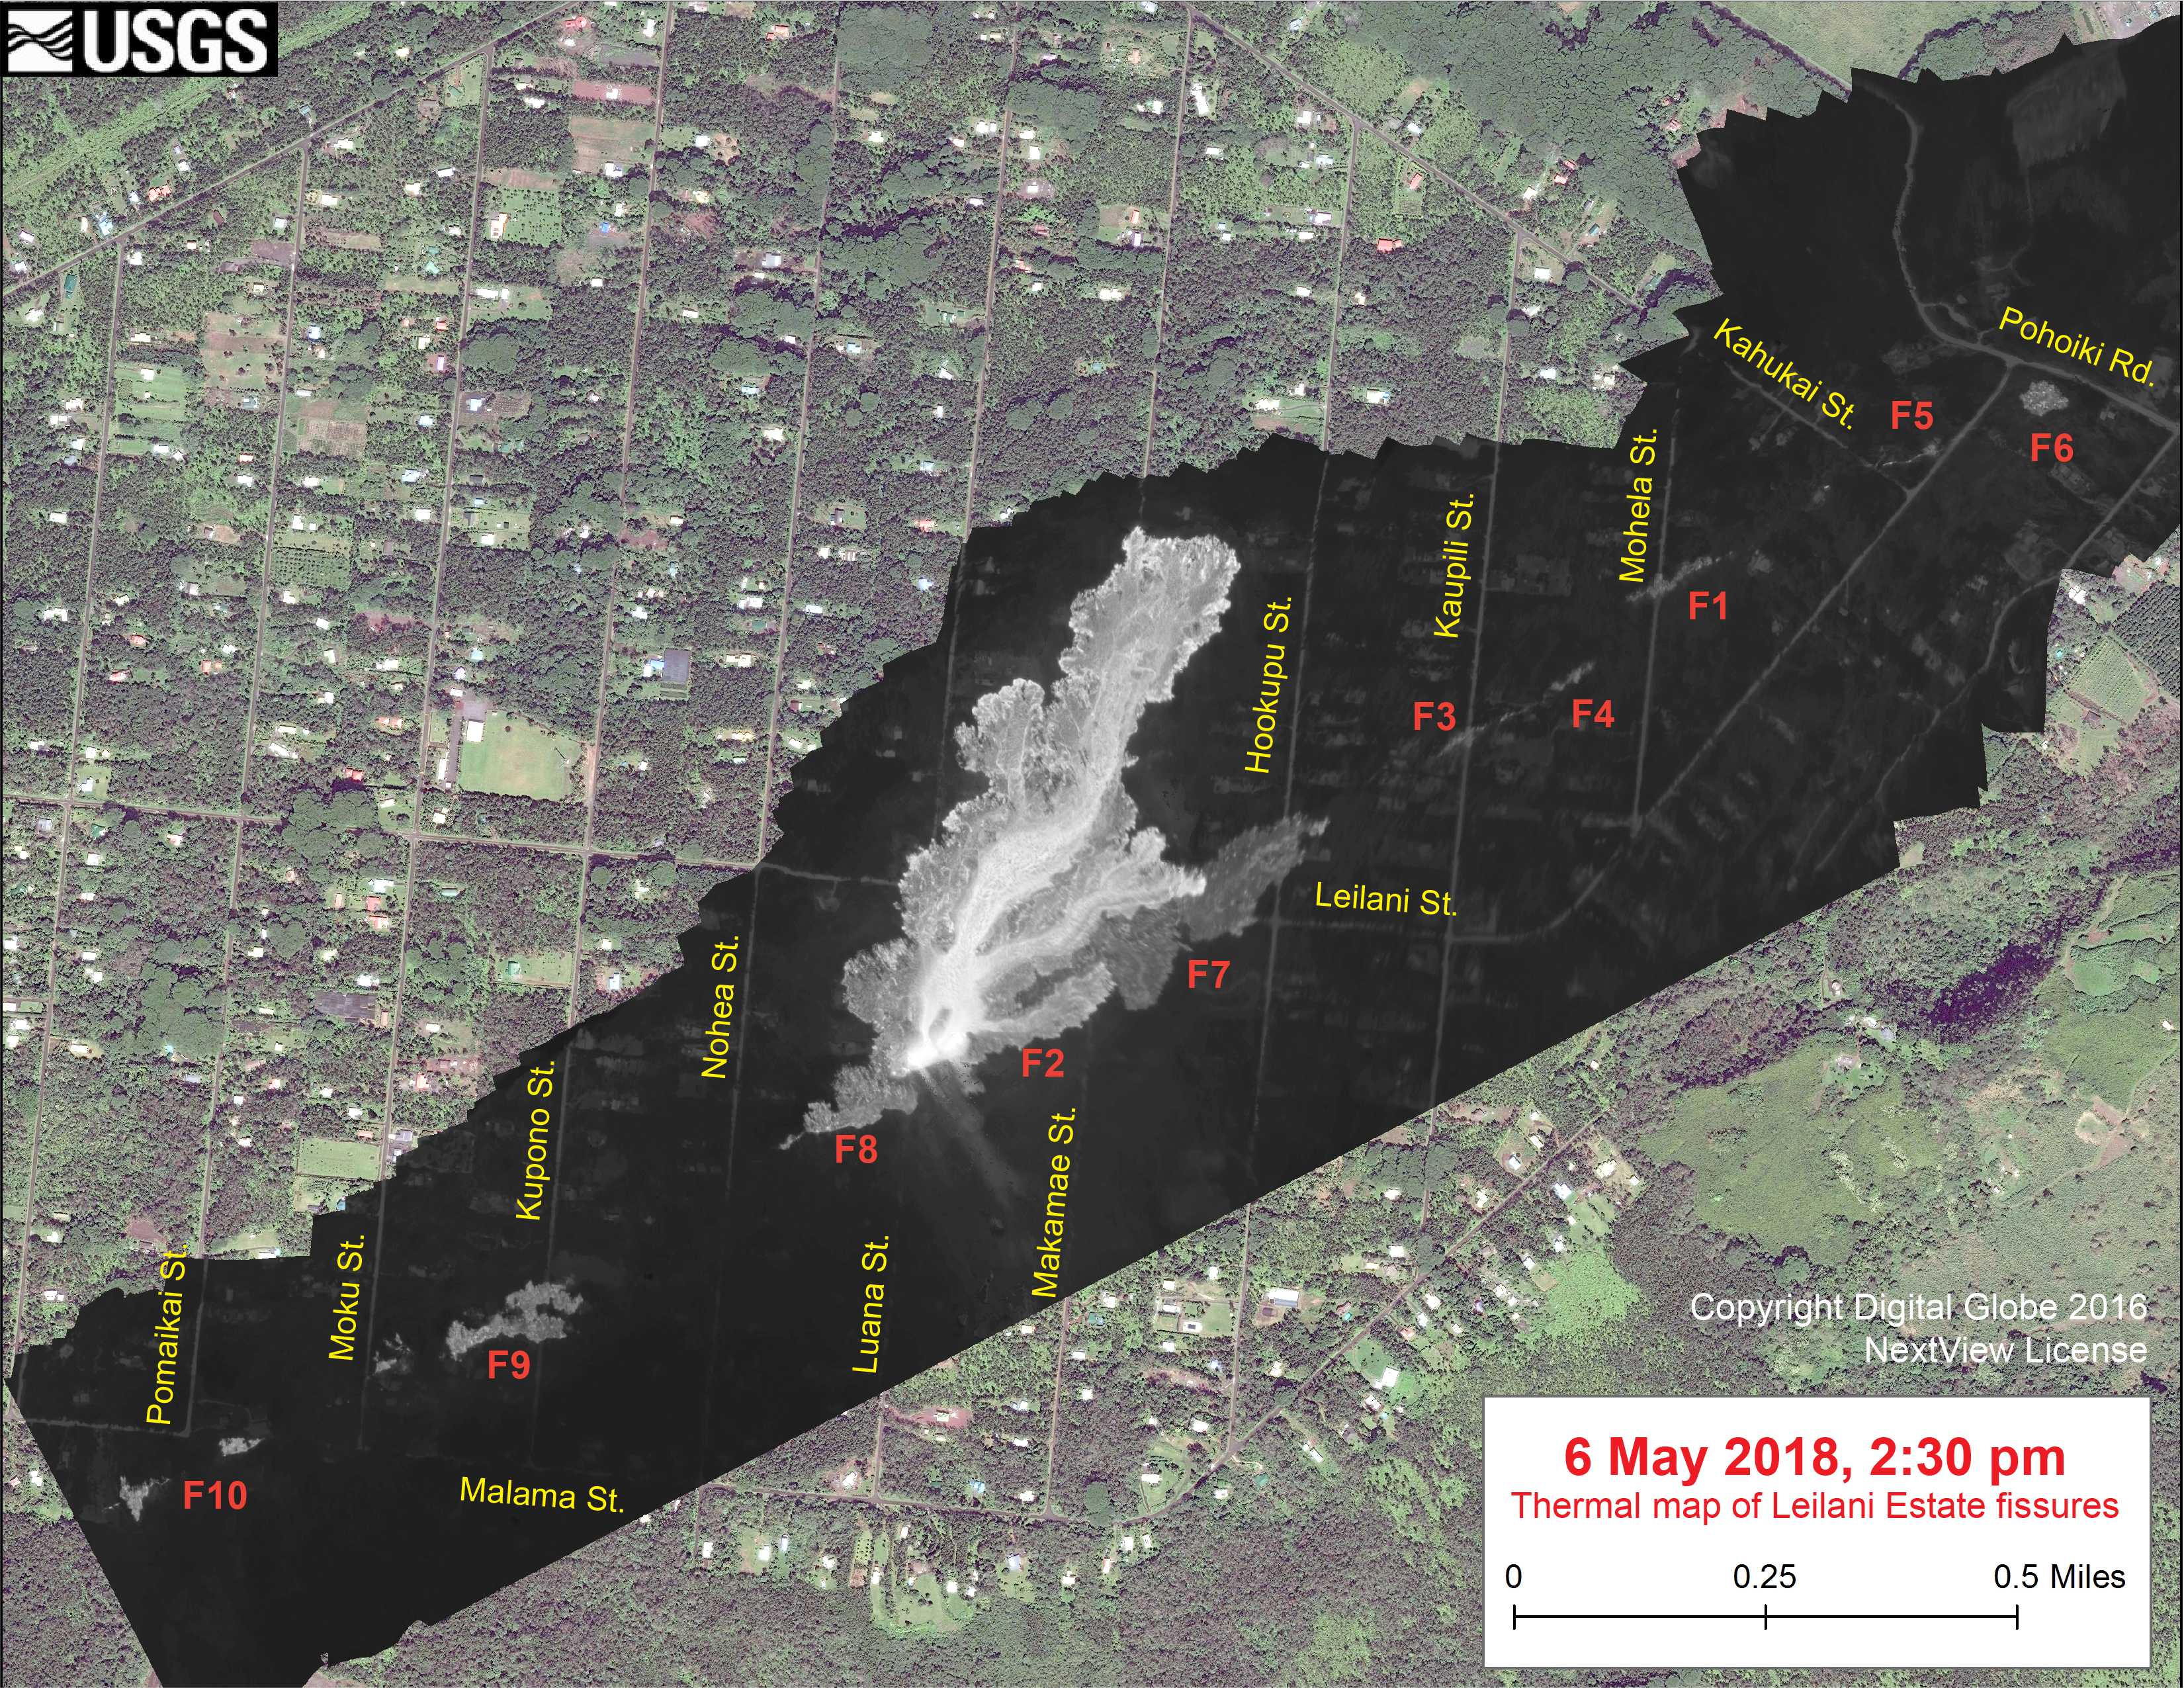
Thermal map of the Leilani Estates fissures

Detailed Description
This thermal map clearly shows the flow spreading northward (top) from fissure 8 during an overflight of the area. The black and white area is the extent of the thermal map. Temperature in the thermal image is displayed as gray-scale values, with the brightest pixels indicating the hottest areas (whitish areas show the active lava flow). The gray linear features are the other fissures (numbered in red color) that have erupted thus far in the sequence. The thermal map was constructed by stitching many overlapping oblique thermal images collected by a handheld thermal camera during a helicopter overflight of the flow field. The base is a copyrighted color satellite image (used with permission) provided by Digital Globe. (see large map)
Sources/Usage
Public Domain.