
U.S. Groundwater Conditions data visualization
By Water Resources Mission Area
January 2022 (approx.)

Detailed Description
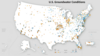
This is a still image from the U.S. Groundwater Conditions animated data visualization, which depicts groundwater levels at 2,281 well sites across the U.S. At each site, groundwater levels are shown relative to the historic record (using percentiles), indicating where groundwater is comparatively high or low to what has been observed in the past. The corresponding time series chart shows the percent of sites in each water-level category through time.
This visualization was developed by the USGS Water Resources Mission Area Vizlab in collaboration with the USGS Groundwater and Streamflow Information Program.
Sources/Usage
Public Domain.