
U.S. River Conditions for January to March 2022 (video thumbnail)

Detailed Description
U.S. River Conditions, January to March 2022
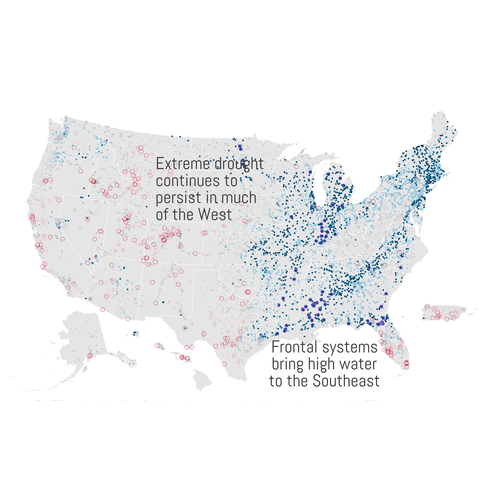
This is a thumbnail from a video animation showing the changing conditions of USGS streamgages from January 1, 2022 to March 31, 2022. The river conditions shown range from the driest condition seen at a gage (red open circles) to the wettest (blue closed circles). A purple outer ring around a gage indicates it is flooding.
From January 4 to January 15, a long-duration atmospheric river brought rain to the Pacific Northwest. From January 16 to January 25, a system brought temporary relief to dry conditions in the Northeast. In early February, a frontal system brought high water to parts of the Eastern U.S. Following that, frontal systems brought high water to the Northeast and Midwest, persisting through March 21. Starting on February 24, an atmospheric river caused flooding in the Pacific Northwest. Frontal systems brought high water to the Southeast from March 9-31. For the entirety of this quarter, extreme drought persisted in much of the West.
Note that both USGS gage height and National Weather Service flood stage levels are necessary to determine flooding conditions and were available for 38% of streamgages at the time this graphic was produced. Only publicly available data from the National Water Information System Website was used and some gages are missing gage height even when they have flow.
Sources/Usage
Public Domain.