
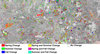
USGS LCMAP data overlay on east-central North Dakota wetlands
By Land Change Monitoring, Assessment, and Projection
2019 (approx.)

Detailed Description
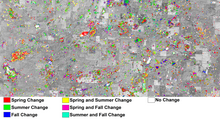
The USGS Land Cover Monitoring, Assessment, and Projection (LCMAP) version 1 Time of Spectral Change product shows when changes occur in wetlands. In this example from east-central North Dakota, red indicates a springtime change, green indicates a summer change, and blue represents a change in the fall. When changes occurred in more than one season, the color represents a mixture of those colors. Pink areas had spring and fall change (red and blue=pink), whereas yellow represents spring and summer change (red and blue=yellow), and areas with cyan changed in the summer and fall (green and blue=cyan). White areas did not have any change from 1985 to 2017.
Sources/Usage
Public Domain.
Related

LCMAP Offers Insight on Dynamic Wetlands
Wetlands are dynamic in nature, growing and shrinking within and between years in ways far less predictable than croplands, forests, or established urban areas.
Related
LCMAP Offers Insight on Dynamic Wetlands
Wetlands are dynamic in nature, growing and shrinking within and between years in ways far less predictable than croplands, forests, or established urban areas.