
Cool Tools & Ready Resources for Hot Science
With labs that rival those of your favorite crime scene investigator and tech that would make even the most resourceful problem-solving secret agent jealous, the USGS is developing and using tools that help answer some of the most pressing questions being asked by wildlife, natural resource, and land managers. Here are just a few:
Clues Left Behind
On detective shows, technicians dust for prints and look for other clues left behind. In a similar fashion, USGS scientists are using environmental DNA, the genetic material (e.g., skin cells, hair, mucus, waste) that an animal sheds or excretes into its surroundings, to detect invasive species. This is especially important for species that are hard to find. Environmental DNA, or eDNA for short, has been used to find the elusive Burmese python in the Everglades and Asian carp in the Great Lakes. Researchers collect eDNA by filtering it out of environmental samples, such as water from a lake that an organism may have passed through recently. The USGS is applying this emerging technology to determine the presence of aquatic organisms like fish, amphibians, and reptiles. Resource managers use the information the USGS provides to prevent the spread of invasive species and manage lands and waters where invasives have been found.
No Library Card Required
Curious about land management in the West? Check out the USGS Land Treatment Digital Library, created to catalog information on past land treatments on Bureau of Land Management lands in 14 Western states. Treatments include prescribed burns, herbicide applications, and fence placements, just to name a few. The oldest record is from 1900, for a prescribed burn by the BLM El Centro Field Office in California. The sprawling database of more than 42,000 records can be explored using the map or searched to find information on individual treatments, sets of treatments, or project-specific information. Building on this wealth of data, the USGS is now developing a tool to help managers access information and learn from the outcomes of similar practices in the past.
Going Batty
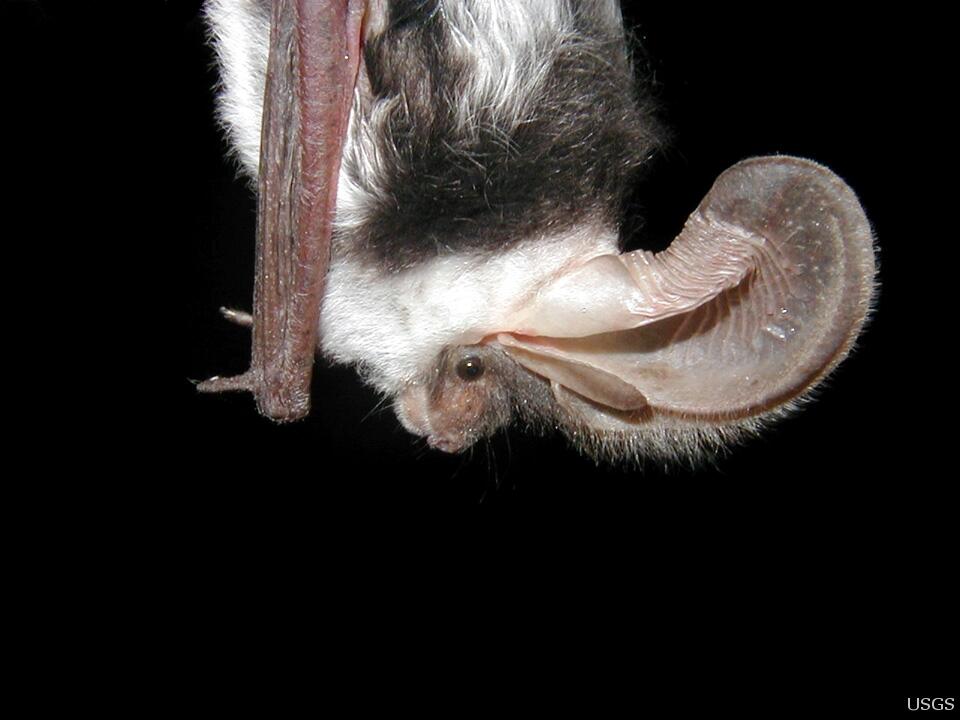
As a certain winged crime fighter could tell you, the bat signal is a call for help. Working with an extensive network of partners through the North American Bat Monitoring Program (NABat), the USGS is doing just that, for bats. By monitoring bat populations across portions of the continent, NABat assesses the status and trends of North American bats at local, regional, and range-wide scales. The collected data are analyzed at various space and time scales and results are used to inform effective conservation actions to ensure the long-term viability of bat populations across the continent which face threats from habitat loss and fragmentation, disease, wind energy development and climate change. Data from NABat helps state, provincial, and federal agencies better prioritize limited resources and engage in cross-agency collaboration, with plans to involve the public in monitoring and conservation activities in the future.
Where the Wind Takes You
Want to know how to find your nearest wind farm? The USGS partnered with the U.S. Department of Energy and the American Wind Energy Association to create the U.S. Wind Turbine Database, which helps you locate any of the more than 57,000 wind turbines currently generating energy in the U.S. These data are used by government agencies, scientists, private companies, and citizens for a variety of purposes. Users can identify the effect of turbines on air defense radar, weather and general aviation. Users can also use the database to help understand the role of wind energy in the U.S. electric grid, interactions between wind energy facilities and wildlife, and investments in wind energy infrastructure.
While it’s clear that wind turbines generate clean power, what’s not as apparent is that their enormous spinning blades can harm birds and bats. Getting a handle on how many birds and bats collide with turbine blades is a difficult task. That’s why USGS statisticians and collaborators developed new software, called GenEst, that aims to improve the accuracy of bird and bat fatality estimates at wind facilities, providing even clearer insights into the interactions of birds, bats and wind turbines.
The Wisdom of the Crowd

The old saying “there is wisdom in the crowd” is the basis for citizen science, which is when members of the public volunteer to work with scientists to tackle tough questions that scientists can’t answer by themselves alone. For example, the North American Breeding Bird Survey — used for assessing the population status of hundreds of bird species each year — relies on thousands of volunteers to contribute millions of observations about migratory birds across the nation during the short breeding season. Another recent application where citizen scientists contribute critical data on the seasonal activity of plants, animals, and habitats is organized by the USA National Phenology Network (USA-NPN). Phenology is the study of nature’s calendar — when cherry trees bloom, when robins build their nests, and when leaves change color in the fall. Citizen scientists participating in the USA-NPN project Nature’s Notebook contribute data that’s used to track seasonal habitat changes in national parks, to understand bird migrations across national wildlife refuges, to help manage invasive plant species, and to conserve and promote habitat for lesser long-nosed bats. Become a citizen scientist yourself; join Nature’s Notebook and share your scientific observations to help scientists “take the pulse of our planet.”
The Mathematics of Detecting Chronic Wasting Disease

Chronic wasting disease, or CWD, is a major health concern for wild deer populations, and it’s present in more than 20 states. Early detection of CWD gives wildlife managers more options to minimize establishment of the disease and to limit its geographic spread. USGS researchers worked with a team to develop a model that resource managers can use to predict where threats might emerge. Use of the model can help wildlife managers apply proactive strategies before the threat arrives and develop effective control programs if an outbreak of CWD occurs. Proactive strategies can help protect critical resources and save money that would be needed for mitigation.
Building a Bridge Between

In animal populations, the rates at which animals are added by births and immigration, or subtracted due to deaths and emigration to other populations, produce the variation we see in a population’s size. Scientists have had to study the processes separately from the population they were tracking, even things that are ecologically related. Scientists face the challenge of having a precise picture of how a population responds to management actions because these data are analyzed separately. USGS scientists are meeting that challenge by taking a new statistical approach called integrated population modeling (IPM), where the data sets for these individual processes interact with each other under a common biological modeling framework, like building a statistical bridge between data sets. Scientists with the Amphibian Research and Monitoring Initiative recently used an IPM approach to model a population of Oregon spotted frogs (Rana pretiosa) in the Klamath Basin of Oregon to improve the way these frogs are reintroduced back to their historic range.
These and other cool tools give decision-makers the information they need and help the USGS provide science for a changing world.