Science to Weather the Storm
USGS Responds to Harvey
To learn more about USGS’ role providing science to decision makers before, during and after Hurricane Harvey, visit the USGS Hurricane Harvey page.

Editor's Note: This story was originally published on August 29 and was updated with new information on August 30, 2017.
As Tropical Storm Harvey moves northeastward into Louisiana after dropping historic amounts of rainfall in east Texas, U.S. Geological Survey crews are navigating the Texas floodwaters by truck and boat to make streamflow measurements that will help determine the depth and extent of the catastrophic flooding underway.
The USGS crews’ field work will help the Federal Emergency Management Agency steer relief to the areas of greatest need. Later, the information will help homeowners and insurers recover from their losses, help FEMA map the flood plains where property is at risk, and help scientists improve future flood forecasting.
The storm is now bringing more rain to Louisiana, Arkansas, Mississippi, and Alabama. USGS crews are expanding their work eastward towards Lake Charles, Louisiana, where Harvey is forecast to drop 6 to 10 inches of rain. USGS researchers and technicians are also preparing to begin flood monitoring work, if necessary, along Harvey’s forecasted path into Tennessee and Kentucky.
In Texas, at least 15 crews are at work from Beaumont to Austin, measuring high flood flows and verifying streamgage operations on the Colorado, Brazos, San Jacinto and Trinity River basins. These teams are taking streamflow and high water measurements from the USGS’ existing network of streamgages and repairing devices that were damaged by the storm. After the flooding subsides they will be collecting high water marks – the telltale lines of seeds, leaves and other debris left on buildings, bridges and trees.
The Texas-based crews have been joined by USGS employees from Arkansas, Louisiana, Mississippi and Oklahoma to help with a massive task. For several days high water made it impossible to reach many streamgages, but by Wednesday some streamgages on the Brazos and Colorado rivers showed water levels had fallen from their earlier peaks. Crews were able to reach some previously inaccessible sites, and made 14 measurements on Tuesday.
Preliminary data showed record flood levels at 16 locations throughout the greater Houston area. At midday Wednesday, 46 USGS streamgages were above National Weather Service flood stage levels.
USGS hydrologists are closely monitoring instruments that track the status of two reservoirs, Barker and Addicks, that are holding back floodwaters near downtown Houston. Measurements related to these two dams are critically important, since 1.2 million people live downstream. The U.S. Army Corps of Engineers has been releasing water from those reservoirs to relieve pressure on them.
Working under police escort, a USGS crew spent Tuesday making emergency repairs to two storm-damaged gauges at the reservoirs, located upstream of Buffalo Bayou, and added an additional rapid deployment gage adjacent to Barker reservoir. These streamgages will help the Corps of Engineers verify how much water they are releasing from the reservoirs.
“Our team is working around the clock to provide flood information that is critical for emergency managers in making informed decisions,” said Terry Schertz, USGS Texas Water Science Center Deputy Director for Hydrologic Data. “We expect to continue assisting federal, state and local agencies by providing flood, water-quality and storm-tide information until well after the storm subsides.”
USGS crews have also begun will also collecting the 16 storm-tide sensors that were quickly deployed along the coast just before Harvey made landfall as a category 4 hurricane near Rockport, Texas the evening of Aug. 25. They will also begin assessing the extent to which Harvey’s storm surge caused Texas coastal dunes to be eroded, overwashed or inundated.
Measuring the Height of the Water
The public has a number of options to access real-time flood information to stay informed during Harvey. The USGS “Water On-the-Go” mobile-friendly website/app allows users to quickly locate USGS gauges in Texas that measure streamflow, stream height, rainfall or lake levels so that users can get up-to-date information on water conditions near where they are located. In addition, the USGS Texas Water Dashboard and accompanying Twitter feeds, @USGS_TexasFlood and @USGS_TexasRain, can be viewed on a desktop, smartphone or other mobile device to quickly provide water and weather information from across the state.
Those outside of Texas interested in flood conditions in their area can also look at the USGS Water Watch website. The site provides real-time water information for locations throughout the country.

As additional flood data is collected, the Flood Event Viewer for Hurricane Harvey will provide key water-level information at different sites. Emergency managers, disaster responders, state and local floodplain management officials and the public can select a data point on the map and learn how high the flood level got during Harvey, and whether a gauge recorded a record-high peak, when, and at what stage. Some rapid deployment gauges (green triangles on the viewer) also provide graphs of the water levels from the time of the gauge’s until its recovery.
In locations without sensors that measure flood levels and streamflow, USGS crews will be visiting sites throughout the coming weeks to look for visual clues of peak flood height. They will mark, survey and document those high water marks. These data will also be available via the flood viewer.
USGS crews measure flood flows at USGS streamgages to determine the flow rates. The measurements are generally made using sophisticated acoustic Doppler equipment. The measured flow rates are used to calibrate the USGS streamgages and ensure that the flood data the gauges collect is accurate and reliable. Once that is assured, the USGS can estimate how rarely the measured flood flow has happened at that location.Scientists often measure the rarity of a flood flow based on its recurrence interval, which is essentially the likelihood that a flood of this level might happen in a given year. These data will be the basis for the design of future dams, water or wastewater treatment plants, and highway bridges, and for delineating the Federal Emergency Management Agency floodplain maps.
When a field crew is unable to reach a streamgage during the flood, they will use surveying equipment to calculate the height of the high water and the geometry of the channel and estimate the flood flow.

Gathering Data on the Storm Surge
The USGS storm-tide sensors deployed before Harvey’s landfall and now being retrieved measure and record storm surge impacts. Waves drive most of the physical destruction accompanying storm-surge. Data from the sensors will be used to by USGS to quantify storm-tide dynamics (wave heights, frequencies, speeds, and extent) for various storm conditions, topographies, ecologies, built environments, and land uses. This information will be used by the USGS and other federal, state and local agencies to develop or design better storm-tide models, and will contribute to more accurate flood forecasts. The data can also be used to inform decisions on designing more effective flood-protection infrastructure, siting building locations, and updating land use policies.
Assessing Coastal Change
Prior to the storm, USGS scientists, using state-of-the-art modeling, forecast what coastal changes were likely to occur on the Texas coast. The storm surge was expected to cause erosion on almost all state beaches, with water overtopping and in some cases inundating dunes. Scientists from the USGS National Assessment of Coastal Change Hazards storm team are now beginning to compare post-storm imagery to predictions of coastal change made in advance of the storm. Before and after photos highlighting coastal changes will be available on the USGS Coastal Change Hazards Portal in the coming weeks.
Check the Maps
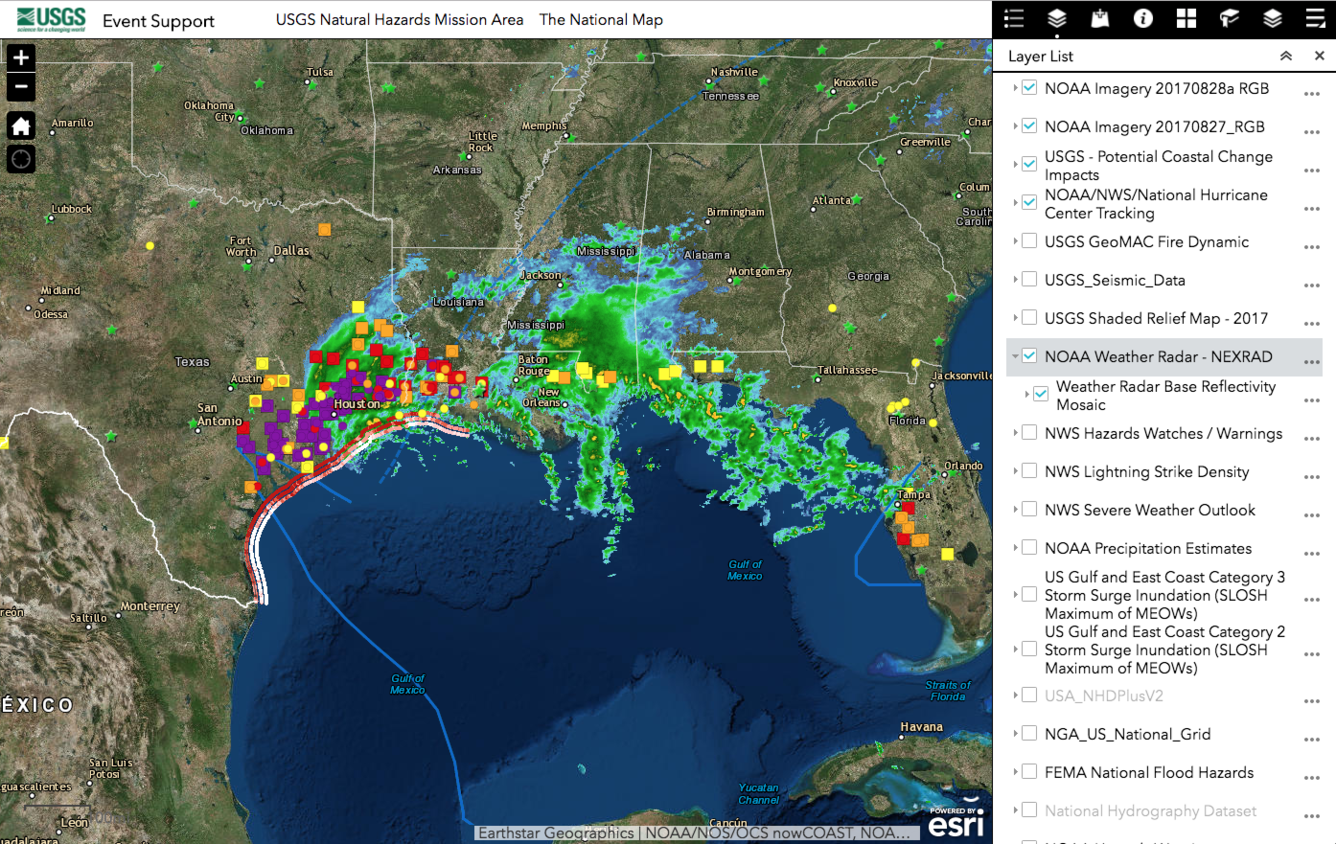
A USGS multi-layered map developed by the USGS National Geospatial Program consolidates key information on Harvey’s warnings and impacts. Called the Event Support Application, this tool can help local, state and federal agencies as they respond to the catastrophic flooding brought by the storm.
Viewers can select different layers to see a wide variety of content from the USGS, National Oceanic and Atmospheric Administration and other agencies. Tornado and flood warnings, rainfall amounts, storm tracks, weather radar, and 3D elevation inventories are among the items available for viewing.
The application was created to provide awareness and resource management of USGS personnel, facilities and mission assignments during a disaster event, and can be used to help responders determine what areas are safe to travel to and work in.
Additionally, satellite imagery and aerial photography from national and international partners will be compiled and distributed on the USGS Hazards Data Distribution System.
To learn more about USGS research and monitoring efforts associated with Hurricane Harvey, visit the USGS Hurricane Harvey webpage.
Editor's note: This story was originally published August 29, 2017 and was updated with new information August 30, 2017.