
USGS Flood Experts Respond to High Water in Central, Northeastern U.S.
Crews from the U.S. Geological Survey have been in the field for weeks measuring flooding in the Midwest and in the Mississippi River watershed, and more recently flooding and storm tides on the Northern Atlantic coast, as higher temperatures, heavy rain, snowmelt and nor’easters affected numerous states.
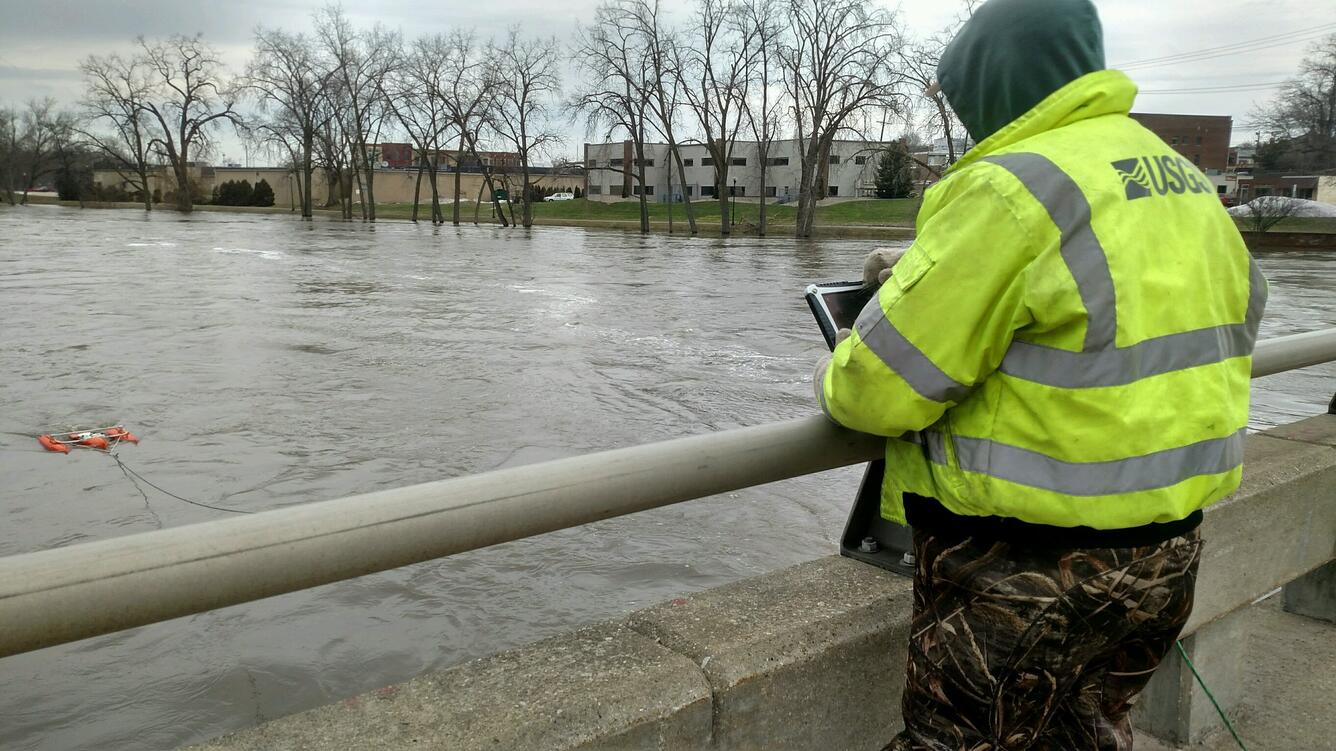
During this string of intense storms, more than 100 USGS scientists and technicians were mobilized across the affected regions to keep the USGS’s streamgage network operational, perform on-site measurements of flooded rivers, install storm-tide and wave sensors prior to the nor’easter, and measure high-water marks as flood waters receded.
A second nor’easter was affecting areas from Virginia to Maine on March 7, and was expected to bring heavy snow to some areas already impacted by the nor’easter that hit the area March 2-3.
In the coming days and weeks, USGS specialists will continue to monitor streamgages, make on-site measurements of river discharge to determine how much water is flowing, and provide data to aid the response in the Midwest and Mississippi watershed. The data from the USGS’ nationwide streamgage network provides vital information to the U.S. Army Corps of Engineers, the National Weather Service, and other state and local agencies, enabling them to make river forecasts, operate flood control structures, and make important emergency management decisions. Besides aiding first responders and other emergency managers during the flooding, USGS streamgage data and flood science is used in the aftermath of floods and coastal storms to make decisions for long-term recovery.
Meanwhile, in the Northeast, coastal communities are just beginning to recover from the first nor’easter. Its intense winds and storm surge caused coastal erosion and tidal flooding in some states, leading to several deaths and leaving almost a million people without power. USGS crews will continue to document coastal flooding in the affected areas by analyzing the data gathered by the storm-tide and wave sensors deployed before the storm, and by flagging and surveying high-water marks, which will indicate to scientists how high the flood waters reached.
As some states struck by the severe weather begin to return to normal, others are dealing with continued flooding and the dangers that come with it. Here’s a look at some ongoing field work the USGS has been involved with over the past few weeks.
Arkansas, Louisiana, Mississippi, and Tennessee

From the upper Midwest to southern Mississippi, as much as 15 inches of rain fell during the past two weeks, causing major flooding in parts of Michigan, Indiana, Illinois, Kentucky, Arkansas, Texas, and Tennessee. In some parts of Arkansas, Tennessee, Mississippi, and Louisiana, as much as 10 inches of rain fell in a five-day period — equal to two months of rain in just a few days. Though recent drought meant that flooding wasn’t as extreme as it could have been, streams exceeded moderate to major flood levels in portions of these four states.
During the flooding, the states recorded numerous peaks of record, or measurements that were the highest ever recorded at those specific streamgages. Visit the Lower Mississippi Gulf Water Science Center website for current conditions of rivers and streams in the Lower Mississippi Gulf region.
Indiana
Beginning February 19, parts of Indiana saw up to seven inches of rain across northern portions of the state. This rain, which fell onto snow-covered frozen ground, increased runoff and caused flooding.
Communities along the Ohio River in the southern portion of the state, such as Evansville and New Albany, were affected. So were parts of South Bend, Elkhart, Goshen, and some smaller towns on the St. Joseph, Kankakee, Iroquois, and Tippecanoe rivers.
Twelve people from the Indianapolis office responded. During the flooding, Indiana saw six peaks of record. Visit the USGS website for current conditions of Indiana’s rivers and streams.
Michigan
In Michigan, heavy rain, melting snowpack, and frozen ground combined to create textbook conditions for flooding. Hundreds of homes and businesses in flood-prone areas of the Grand, Kalamazoo, and St. Joseph river watersheds were affected. Though high water has largely subsided, some waterways are still overflowing their banks.
More than 20 crews were deployed in Michigan to take streamflow and water-level measurements and the state recorded seven peaks of record. For up-to-date information on rivers and streams in Michigan, visit the USGS website.
Kentucky

Heavy rainfall in late February across the upper portion of the watershed caused moderate to major flooding along the middle and lower Ohio River. At the request of the U.S. Army Corps of Engineers, researchers used a boat to make special discharge measurements at various locations downstream of Barkley and Kentucky lakes. The Corps had not released a volume of water this large from those reservoirs since 2010, and wanted to verify the amount to be released. Along the Ohio River, USGS crews collected the highest discharge measurements ever taken at three different gauges. Special water quality samples were also collected for the National Water Quality Program on the lower Ohio River at two locations. Thirteen people from the USGS offices in Murray and Louisville responded over the course of 10 days.
Ohio
As with other states, flooding in Ohio was caused by rain and snowpack thaw. While the state was spared more severe rainfall, the combination of an inch or two of rain daily on top of already saturated ground made for flooding.
The flooding in Ohio has now subsided but during the event, more than 10 crews in Ohio measured high flows in Ohio. Visit the USGS website for current conditions of rivers and streams in the state of Ohio.
The Northeastern states
On Friday, March 2, a powerful nor’easter struck the Mid-Atlantic and New England states for the second time this winter, similar to a storm that caused record-breaking flooding in parts of the region in January. With strong winds and high waves, a major nor’easter can lead to flooding equivalent to or greater than a hurricane’s effect.

USGS field crews deployed over 50 storm-tide and wave sensors from Maine to Delaware the day before the March 2 storm made landfall. The sensors are part of a relatively new USGS mobile network of instruments, designed for rapid deployment in the path of an oncoming storm, called the Surge, Wave, and Tide Hydrodynamics Network, or SWaTH Network. They continuously measure wave height and tide levels and provide information on the timing, duration, and extent of storm-tide flooding. Data are collected four times per second, providing a detailed picture of the storm.
Scientists went back to recover the sensors on March 5 and 6, as soon as it was safe to do so after the storm. All data from the sensors will be available via the USGS Flood Event Viewer later this week, and over the coming weeks USGS scientists will closely analyze the information.
USGS research teams also spread out along the coast from Maine to Connecticut starting on March 4, to document the storm-tide flooding by flagging and surveying high-water marks, which are debris and dirt lines that reveal how high the flood waters reached. The teams’ first priority was to visit locations where high-water marks were found after a record-breaking blizzard that struck the region in 1978, and high-water mark locations from the January 2018 nor’easter, so the effects of those three significant storms can be carefully compared. Time was of the essence, since the winter storm of March 7 could wipe away the high-water marks.
The information gathered from the sensors and high-water marks will help officials understand coastal storms, prepare for their impacts, and ultimately build more resilient communities. Real-world data on a variety of storms and tracks allow for more precise and informed forecasts for future scenarios.
In southeast New York, USGS’ network of permanent real-time tide gauges recorded high water levels that persisted through six full cycles of high and low tides before gradually receding, with minor to moderate flooding recorded at 16 different gauges. Water levels reached major flood heights at one location, the Hudson Bay at Freeport, New York. That state’s crews were also out in the field collecting high-water marks and retrieving storm-tide and wave sensors soon after the high waters receded, and information about the New York coastal flooding is also available on the USGS Flood Event Viewer.
Looking Toward the Future
Though flooding in the affected states has largely subsided, the USGS will continue to monitor stream conditions and use data collected to prepare for future disasters. For up-to-date info on conditions in your area visit the USGS WaterWatch website. Sign up for high-water alerts at the USGS WaterAlert website.
The USGS Coastal Change Hazards Portal provides forecasts on the potential for beach erosion, overwash and inundation during hurricanes and other severe coastal storms.
Real-time, six-hour forecasts of storm-induced total water levels and potential coastal changes can be found through the USGS Total Water Level Viewer.
The USGS also operates a network of permanent tide gauges that provide real-time information through the National Water Information System. These gauges supplement NOAA's long-term network of gauges.