
Value of U.S. mineral production rose last year, driven by precious metals prices
The USGS releases Mineral Commodity Summaries 2026, the first and most authoritative source for mineral production, trade and consumption data
RESTON, Va. — The overall value of U.S. mineral production rose by 5.6% to \$112 billion in 2025, according to the U.S. Geological Survey’s annual Mineral Commodity Summaries, driven by changes in the price of precious metals such as gold and silver.
The report also highlights the overall importance of nonfuel minerals to U.S. industries including aerospace, electronics and construction. Mineral-reliant industries represented \$4.09 trillion in value in 2025, more than one-eighth of the U.S. economy.
The report also updates data on U.S. import reliance for critical minerals. The U.S. remained reliant on imports from China as a major source for 14 of the 33 critical minerals for which the U.S. most depends on imports. The section on trade covers 14 minerals, from antimony to tungsten, that China restricts being exported to the United States.
The annual Mineral Commodity Summaries report is a comprehensive source of nonfuel mineral commodity data for the world. In addition to U.S. production and critical minerals, it includes information on the domestic industry structure, government programs, tariffs, resources, reserves, world production and five-year salient statistics for 90 nonfuel mineral commodities that are important to U.S. national security and economic stability. It also identifies events, trends and issues in the domestic and international minerals industries that affect production and consumption.
“Critical minerals have become central in U.S. Government policymaking and international relations. In 2025 the minerals industries contributed over $4 trillion to the U.S. economy, and clearly minerals will be the lifeblood of the 21st century global economy,” said Ned Mamula, director of the USGS. “For 30 years, these reports have shown the importance of minerals — and increasing U.S. reliance on critical mineral imports. This year’s edition notes policies, agreements and major investments by the Trump Administration to begin to lessen that reliance. These statistics are produced with the same rigorous, Gold Standard scientific integrity and expertise that the USGS brings to all our work.”
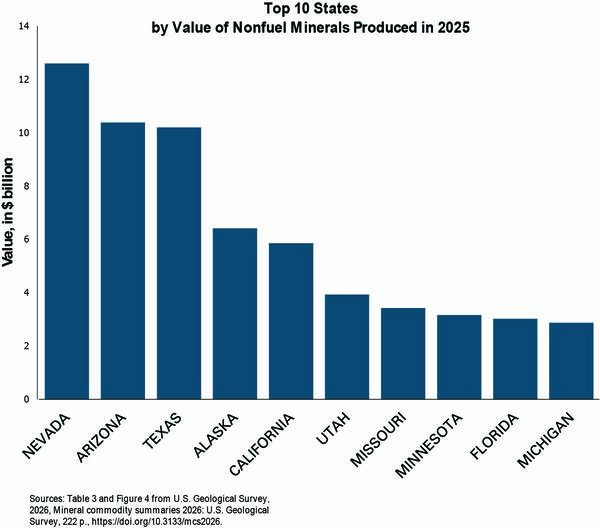
Nevada was the leading mineral producing state (by value) for the second year in a row, but Arizona’s production overtook Texas for second place. Nevada had been the leading miner from 2015 to 2020, but then in 2021 and 2022 Arizona was the leader, and in 2023 Texas was the leader.
Arizona surpassed Texas as the second-ranked miner on account of the increased value of production for copper, molybdenum, gold, and silver. In Texas, the value of its construction-related mineral production increased, but not as much as Arizona’s base and precious metals. In the western states, changes in copper, gold, molybdenum, and silver production values drove an increase of total mine production across the region by \$6.8 billion, to \$32.8 billion.
Net imports of processed metals and materials more than doubled by value from the 2024 level of \$77 billion to \$185 billion in 2025. The MCS reports on factors that impacted that total, including industrial stockpiling.
World lithium production rose 31% and consumption by 20%; U.S. production increased as well, although production figures were withheld to protect proprietary data.
Finally, the February release of the MCS comports with the President’s recent announcement of “Project Vault” – a critical minerals stockpile focused on rare earths, lithium, nickel, and similar metals that are central to advanced manufacturing, defense, and clean energy technologies – and the President’s proclamation in January on imports of processed critical minerals and their derivative products.
Read the Mineral Commodity Summaries at https://doi.org/10.3133/mcs2026
An interactive version can be accessed at https://apps.usgs.gov/critical-minerals/mineral-commodities-2026.html
The USGS provides science for a changing world. Learn more at usgs.gov or follow us on Facebook @USGeologicalSurvey, YouTube @USGS, Instagram @USGS, or X (formerly Twitter) at @USGS.