
In an article written for the Interagency Ecological Program for the San Francisco Estuary, Dr. Paul Work and Dr. Maureen Downing-Kunz, of the California Water Science Center, provide examples of the work being done to measure water flow and quality in the San Francisco Estuary.
Below is the article in its entirety.
State of the Network: Long-Term, High-Frequency Flow and Water Quality Data in the San Francisco Estuary, California
Contribution for Interagency Ecological Program (IEP) newsletter
Paul A. Work, Maureen Downing-Kunz
US Geological Survey, California Water Science Center, Sacramento
The USGS California Water Science Center is heavily involved in the measurement of flow and water quality parameters in the San Francisco Estuary, with support from many partner agencies. The California Department of Water Resources (DWR), through the Interagency Ecological Program (IEP) is one of those agencies. This article describes the resulting efforts and methodologies and provides examples of some of the uses of the data sets for science and management interests.
The DWR/IEP-funded flow and water quality network provides high resolution data in both space and time, over a large portion of the San Francisco Estuary. This measurement network has evolved over the preceding decades, and proven invaluable for both management and science interests, with particular relevance to water supply and endangered species issues. Presented below are a summary of the measurement network, some of the methods being utilized, and some interesting conditions that became evident during the recent drought that spanned Water Years (WY) 2013-2016, and the wet WY2017 (water year spans Oct 1-Sept 30).
Table 1 and Figure 1 below summarize the stations that are currently operated with IEP funding, and the parameters measured. Note that the entire network of USGS stations within the San Francisco Estuary includes additional stations supported by additional partners, and the efforts of other offices. Here the focus is exclusively on stations funded by IEP/DWR and maintained by personnel from the USGS California Water Science Center, based in Sacramento.
Table 1. USGS stations maintained with support from IEP and DWR. “I” means parameter supported via IEP funds, “o” means supported via other funds, “D” means maintained by DWR (whose network is much more extensive than shown here). Dashes indicate parameters not collected. Some stations feature additional parameters not shown here. Most stations deliver near-real-time data at fifteen-minute intervals. Initiation year corresponds to start of high-frequency data collection. See https://waterdata.usgs.gov/nwis for more details. DWR data can be found at CDEC, https://cdec.water.ca.gov/.
| Station Name | NWIS Station Number | Water Year Initiated | Discharge, stage | Water Temperature, Conductance | Turbidity |
|---|---|---|---|---|---|
| Sacramento River below Wilkens Slough near Grimes | 11390500 | 1988 | o | I (Temp only) | -- |
| Sacramento River above Delta Cross Channel | 11447890 | 1993 | I | o | o |
| Sacramento River below Georgiana Slough | 11447905 | 1993 | I | o | o |
| Sacramento River at Rio Vista | 11455420 | 1995 | I | o | o |
| Three-mile Slough near Rio Vista | 11337080 | 1994 | I | D | D |
| San Joaquin River at Jersey Point | 11337190 | 1994 | o | o | |
| Dutch Slough below Jersey Island Road at Jersey Island | 11313433 | 1996 | I | o | o |
| Old River at Bacon Island | 11313405 | 1987 | I | D | D |
| Middle River at Middle River | 11312676 | 1987 | I | o | o |
| San Joaquin River below Garwood Bridge at Stockton | 11304810 | 1995 | I | o | o |
| Old River near Byron | 11313315 | 1999 | I | o | o |
| Old River near Delta Mendota Canal | 11312968 | 1999 | I | D | D |
| Grant Line Canal at Tracy Road Bridge | 11313200 11313240 | 1999-2005 2005-on | I | D | D |
| San Joaquin River near Vernalis | 11303500 | 1987 | o | I (Temp only) | o |
| Suisun Bay at Benicia Bridge near Benicia | 11455780 | 1998 | -- | I | o |
| Carquinez Strait at Carquinez Bridge near Crockett | 11455820 | 1999 | -- | I | |
| San Francisco Bay at Richmond-San Rafael Bridge | 375607122264701 | 2007 | -- | I | o |
| San Francisco Bay at NE Shore Alcatraz Island | 374938122251801 | 2004 | -- | I | o |
| San Francisco Bay at San Mateo Bridge near Foster City | 11162765 | 1990 | -- | I | |
| South San Francisco Bay at Dumbarton Bridge | 373015122071000 | 2011 | -- | I | o |

Measurement Techniques
Flows at most of the stations discussed here are strongly tidally forced, which influences both the method and frequency of data collection. Whereas stage (water level) in a non-tidal stream or river is often used successfully as a proxy for discharge, this approach does not work well in tidal environments. Instead, an index-velocity approach is used: a measured velocity at a particular location in the channel cross-section is used as a proxy for cross-sectionally averaged velocity, and then this estimated mean velocity is multiplied by instantaneous cross-sectional area of the flow to get instantaneous discharge (Ruhl and Simpson 2005). The proxy is referred to as the index velocity. Figure 2 shows a plan view of the measurement scheme.

Flow velocity data are acquired with acoustic sensors, generally a fixed mounted acoustic Doppler velocity meter (ADVM), deployed on one side of a channel and aimed to measure across the channel cross-section (Figure 3). A similar instrument is used periodically, deployed in a down-looking fashion from a moving vessel, to measure instantaneous, total channel discharge (Mueller et al. 2013). Together, these datasets allow determination of one location in the channel cross-section that serves as a good proxy for cross-sectionally averaged velocity – the index-velocity location. The channel cross-section is also surveyed periodically to allow the establishment of a relationship between stage (height of the water surface relative to a vertical datum) and cross-sectional area of the channel.

Then every 15 minutes, the following steps take place:
- The acoustic sensor measures velocity over a defined burst period (minutes)
- The velocity data are averaged over the burst period
- Data from the index-velocity location is used to look up instantaneous mean velocity (cross-section average)
- Stage data are acquired with the acoustic sensor or a separate pressure transducer
- Cross-sectional area is looked up in a table that reflects dependence on stage
- Mean cross-section velocity is multiplied by cross-sectional area to get instantaneous discharge.
- Other sensors are polled and the data averaged as appropriate to define water quality parameters such as temperature, specific conductance, and turbidity.
- The data are relayed via wireless modem and posted to https://waterdata.usgs.gov/nwis as provisional data that are later reviewed and approved, according to USGS requirements.
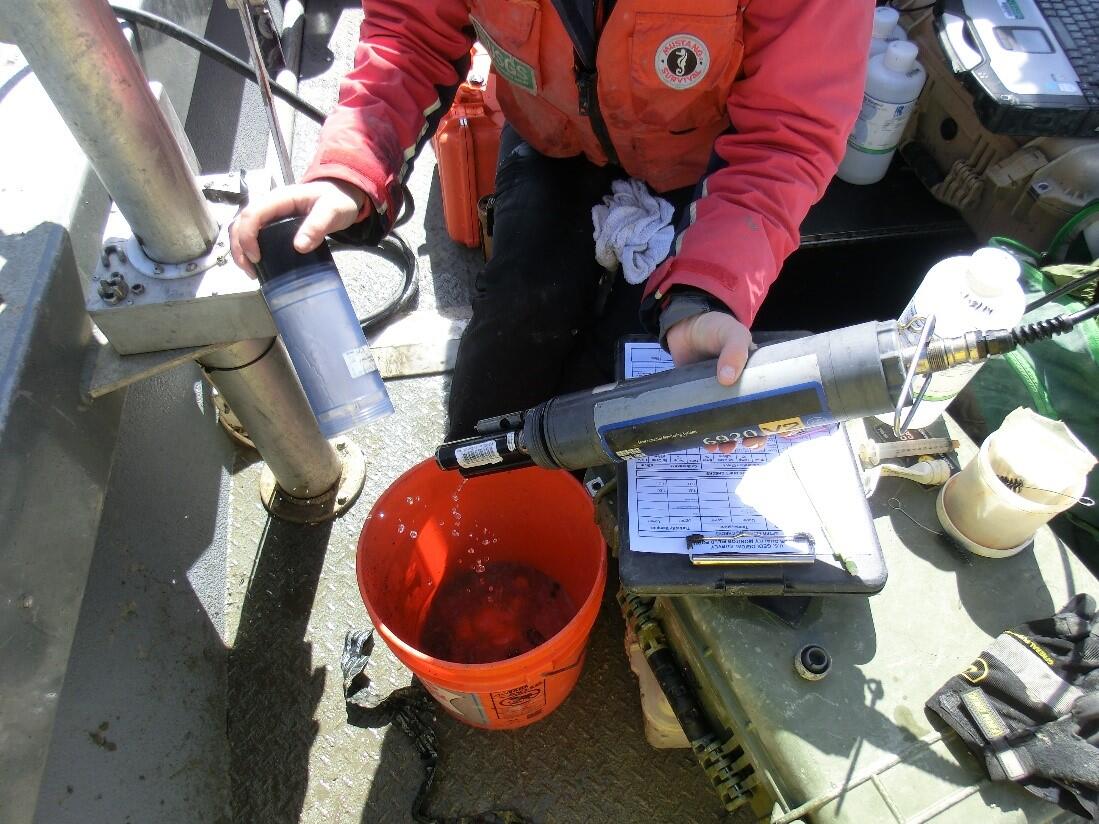
Each station is visited many times throughout a water year for servicing and acquisition of information required to apply appropriate corrections to data, to compensate for instrument drift and fouling. Channel cross-sections are re-surveyed periodically, as they can change due to storm events. Three-week servicing intervals are not uncommon. USGS policies dictate how and when site visits are conducted to check sensors and conditions (U.S. Geological Survey, variously dated; Figure 4). Burau et al. (2016) provide further details about measurement techniques, how station locations are chosen, and how the data are used to answer science and management questions.
Several of the bridges crossing San Francisco Bay are instrumented, and feature water quality instruments deployed simultaneously at two depths (Figure 5). The degree of stratification evident is time-dependent, and dependent on distance from the Golden Gate, where the flow is strongly mixed.

Drought Effects on San Francisco Bay
California and much of the western United States experienced a pronounced drought that spanned water years 2013-2016. Many of the USGS stations in San Francisco Bay saw record-high values of water temperature and specific conductance during this period. Downing-Kunz et al. (2015) discuss record-high values observed through Water Year 2014 (October 1 2013 – September 30 2014); Work et al. (2017) updated this report to include Water Year 2015. Between just these two water years, every station in San Francisco Bay saw new record-high values of water temperature and specific conductance.
The trends in the mean annual values are more interesting and usually more significant than instantaneous peaks. Figure 6 shows time dependence in mean annual specific conductance and water temperature, by station and year. The bottom panel shows annual Delta outflow (i.e., inflow to the Bay), as reported output from the DWR DAYFLOW model (California DWR, 2017). During years with higher Delta outflow (2011, for example), observed annual mean salinity at all Bay stations is decreased. In general, drought impacts on mean annual salinity increased with distance from the seaward boundary of the estuary, as might be expected.
The influence of the drought on mean annual water temperatures in the Bay was much more pronounced. All five stations for which data were sufficiently complete for analysis show a continuous increase in mean annual water temperature from 2011-2015, and the temperature increase over this period is close to 2 deg C. This change is affected not only by inflow to the bay, but also by changes in air temperature, winds, humidity, cloud cover, and ocean water temperatures.

Figure 7 provides another view of the importance of annual Delta outflow on mean annual specific conductivity and salinity in the Bay. Not surprisingly, as Delta outflow is reduced, mean annual salinity at the Bay stations increases, with the most significant increases being observed at the stations furthest from the Golden Gate.
Additional work is underway to reveal longer-term patterns in temperature and specific conductivity in both the Bay and the Delta. Both changes that arise due to episodic events such as droughts and longer-term processes are of interest, and have the potential to be important components of environmental and habitat health.

Delta Temperature and Flow Variability
Measured flows of water in the Delta are of critical importance on their own for management decisions, but also because of the various constituents transported by the moving water – heat, salt, nutrients, contaminants, and organisms. The measurement domain is tidally forced, experiencing semi-diurnal tidal flows on which mean flows due to riverine inflows are superimposed. Often it is the mean (tidally averaged) flow that is of interest and must be extracted from the oscillating signal. During summer or drought conditions, it is not uncommon for the mean flow to be two orders of magnitude smaller than the instantaneous (measured) flow. This means that a 1% error in the measurement will be as large as the actual mean flow.
This uncertainty at low flows is part of the reason for the DWR DAYFLOW model to simulate net flows (California DWR, 2017). Measured flows at selected locations are used for input to this model. Data from USGS stations at Sacramento River at Freeport (11447650), Yolo Bypass at Woodland (11453000), Cosumnes River at Michigan Bar (11335000), San Joaquin River at Vernalis (11303500), Delta Cross Channel (11336600), and Georgiana Slough (11447903) all serve as input, to predict net Delta outflow, which in turn becomes inflow to San Francisco Bay. Most of the discharge measurement stations in the Delta also feature water quality data sondes to report water temperature, specific conductivity, turbidity, and other parameters.
Important annual and intra-annual variability exists in each of the measured signals. Figure 8 shows measured water temperatures at USGS station 11455420, Sacramento River at Rio Vista, CA, for three water years: 2011, which was a wet year, 2014, which was within a multi-year drought, and 2017, a very wet year. Mean annual values reveal that water year 2017 was much cooler than 2014. But a sharp increase in temperature is observed in WY2017, beginning near day 250 (early June), bringing the temperature into the range seen during the drought. A similarly sharp increase in air temperature was observed simultaneously (data from California’s CIMIS database; https://cimis.water.ca.gov/.)

Figure 9 shows time series of water temperature, instantaneous discharge, and tidally averaged discharge at the same Rio Vista station for water year 2017, and sheds further light on the temperature increase shown in Figure 8. The middle panel in Figure 9 reveals that the magnitude of the tidally forced discharge typically has peak magnitude of 3,000 cms, which is more than tripled in this particular year by a major runoff event (the same event that led to failure of the spillway at the Oroville Dam in the Feather River watershed upstream). The tidally averaged discharge (lower panel) reveals that the rapid rise in water temperature in early June coincided with the last of the runoff from this event. As noted above, air temperature increased significantly at the same time.

Conclusions
The San Francisco Estuary is physically forced on a range of time scales – tidal, seasonal, annual, and longer, and organisms are being influenced by this forcing, at all time scales. In order to detect trends and changes in flow and water quality, measurements are required at sufficient resolution in time and space, over a sustained period of time. USGS currently maintains a network of dozens of stations reporting flow and water quality data at 15-minute intervals, with a multi-decade record of similar observations. Only a few examples from this dataset have been shown here; the data are used on a daily basis to meet both management and science needs.
Acknowledgments
The work shown here required the support of IEP, DWR, other sponsors, and a very large team of technicians and analysts over a multi-decadal time period. The team is too large to acknowledge individually, but their contributions were crucial, and are recognized here.
References
Buchanan, P.A., Downing-Kunz, M.A., Schoellhamer, D.H., and Livsey, D.N., 2018. Continuous water-quality and suspended-sediment transport monitoring in the San Francisco Bay, California, water years 2014–15 (ver. 1.1, May 2018): U.S. Geological Survey Fact Sheet 2018–3013, 5 p., https://doi.org/10.3133/fs20183013.
Burau, J.R., Ruhl, C.A., and Work, P.A., 2016. Innovation in Monitoring: The U.S. Geological Survey Sacramento-San Joaquin River Delta, California, Flow-Station Network: U.S. Geological Survey Fact Sheet 2015-3061, 6 p., http://dx.doi.org/10.3133/fs20153061.
California DWR, 2017. DAYFLOW Model, https://water.ca.gov/-/media/DWR-Website/Web-Pages/Programs/Environmental-Services/Compliance-Monitoring--Assessment/Dayflow/Files/Publications/Current-Dayflow-Documentation.pdf.
Downing-Kunz, M.A., Work, P.A., and Shellenbarger, G.G., 2015. Record-high specific conductance and temperature in San Francisco Bay during water year 2014 (ver. 1.1, December 28, 2015): U.S. Geological Survey Open-File Report 2015–1213, 4 p., https://pubs.er.usgs.gov/publication/ofr20151213.
Levesque, V.A., and Oberg, K.A., 2012. Computing discharge using the index velocity method: U.S. Geological Survey Techniques and Methods 3–A23, 148 p. (Available online at http://pubs.usgs.gov/tm/3a23/).
Mueller, D.S., Wagner, C.R., Rehmel, M.S., Oberg, K.A., and Rainville, F., 2013. Measuring discharge with acoustic Doppler current profilers from a moving boat (ver. 2.0, December 2013): U.S. Geological Survey Techniques and Methods, book 3, chap. A22, 95 p., https://dx.doi.org/10.3133/tm3A22.
Ruhl, C.A., and Simpson, M.R., 2005. Computation of discharge using the index-velocity method in tidally affected areas. U.S. Geological Survey Scientific Investigations Report 2005-5004, https://pubs.usgs.gov/sir/2005/5004/.
U.S. Geological Survey, variously dated. National field manual for the collection of water-quality data: U.S. Geological Survey Techniques of Water-Resources Investigations, book 9, chaps. A1-A10, available online at http://pubs.water.usgs.gov/twri9A.
Work, P.A., Downing-Kunz, M.A., and Livsey, D., 2017. Record-high specific conductance and water temperature in San Francisco Bay during water year 2015: U.S. Geological Survey Open-File Report 2017–1022, 4 p., https://doi.org/10.3133/ofr20171022.