
ScienceBase Updates - Spring 2021
Spring 2021 topics include information on the new ScienceBase data release summary dashboard, guidance for what to include (and not include) in a data release, a tip on creating shortcuts, and a featured data release on the State Geologic Map Compilation.

Explore the New ScienceBase Data Release Summary DashboardWe are excited to announce the release of the new ScienceBase Data Release (SBDR) Summary Dashboard! Over the last five years, USGS researchers and data managers have been releasing a lot of data through ScienceBase (4,185 data releases at the current count). The SBDR Summary Dashboard provides an overview of these data releases to help USGS data managers, center directors, and leadership understand how much data we are releasing, who is releasing the data, and how often the data are viewed or downloaded. Please share this dashboard with your Center leadership! First, see how the data releases are broken down by USGS Mission Area, Region, and Science Center.
Media

Sources/Usage: Public Domain. View Media Details
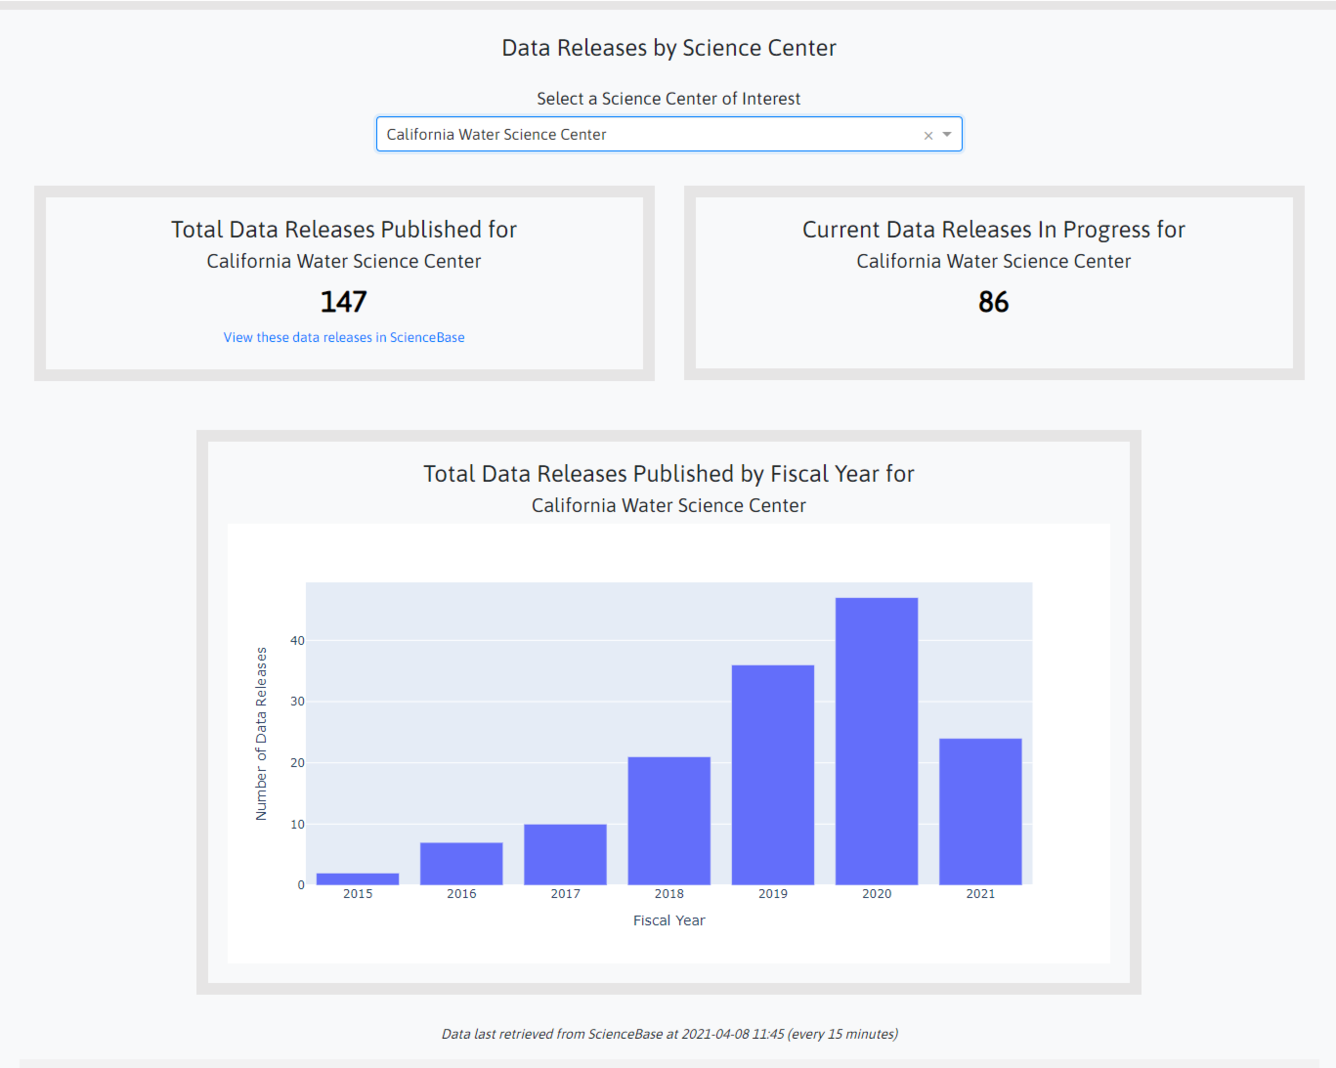
Then, drill down into a particular science center to see data release trends over time.
Media
Sources/Usage: Public Domain. View Media Details
Finally, filter by date and learn more about individual data releases, including the number of landing page visits and file downloads.
Media

Sources/Usage: Public Domain. View Media Details
If you have questions about the ScienceBase Data Release Summary Dashboard, contact sciencebase_datarelease@usgs.gov.
|


Featured Data Release
Media

Sources/Usage: Public Domain. View Media Details
Geologic map of the conterminous United States (Horton, 2017). Horton, J.D., 2017, The State Geologic Map Compilation (SGMC) geodatabase of the conterminous United States (ver. 1.1, August 2017): U.S. Geological Survey data release, https://doi.org/10.5066/F7WH2N65. USGS Data Owner: Mineral Resources Program The State Geologic Map Compilation (SGMC) geodatabase of the conterminous United States (https://doi.org/10.5066/F7WH2N65), released in 2017, represents a seamless spatial database of 48 State geologic maps that range from 1:50,000 to 1:1,000,000 scale. The data release associated with this geodatabase is regularly one of the most accessed pages in ScienceBase. As national-scale datasets that were years in the making, the SGMC geodatabase appeals to a wide audience across the scientific spectrum. A major contributing factor the author credits this dataset's popularity with is the associated map service. The author and their team dedicated time to designing the map service to ensure that it looks and performs as well as possible. The map service URL address can be used to provide access through multiple applications, without the need to download and interact with the actual data files. The map service for the SGMC was chosen for inclusion in the ArcGIS Living Atlas of the World, is available through ArcGIS Online (AGOL), has been featured through the USGS National Map Advanced Viewer, and is being consumed by numerous web and standalone mobile applications, like Flyover Country; Rockd and Macrostrat. If you’d like to increase usage of your data release through web services, learn how to create services from shapefiles, rasters, and ArcGIS service definition files, and how to connect to the different types of services through ScienceBase help pages and tutorials. Frequency of access is only one way of measuring the impact of a data release. If you know of a data product available in ScienceBase that has gone on to be reused in other projects, inform policy decisions, garner attention in major media outlets, or any other interesting use, we'd love to hear about it. Please complete this form to contribute your data story. Any use of trade, firm, or product names is for descriptive purposes only and does not imply endorsement by the U.S. Government. |
Guidance for Unique Cases: What to Include (and Not Include) in a USGS Data Release
USGS authors often have questions on which files or content should be included in a data release in ScienceBase. The best approach for handling products from a research effort may vary case by case, but some general considerations are listed below for some unique cases.
What to consider when handling...
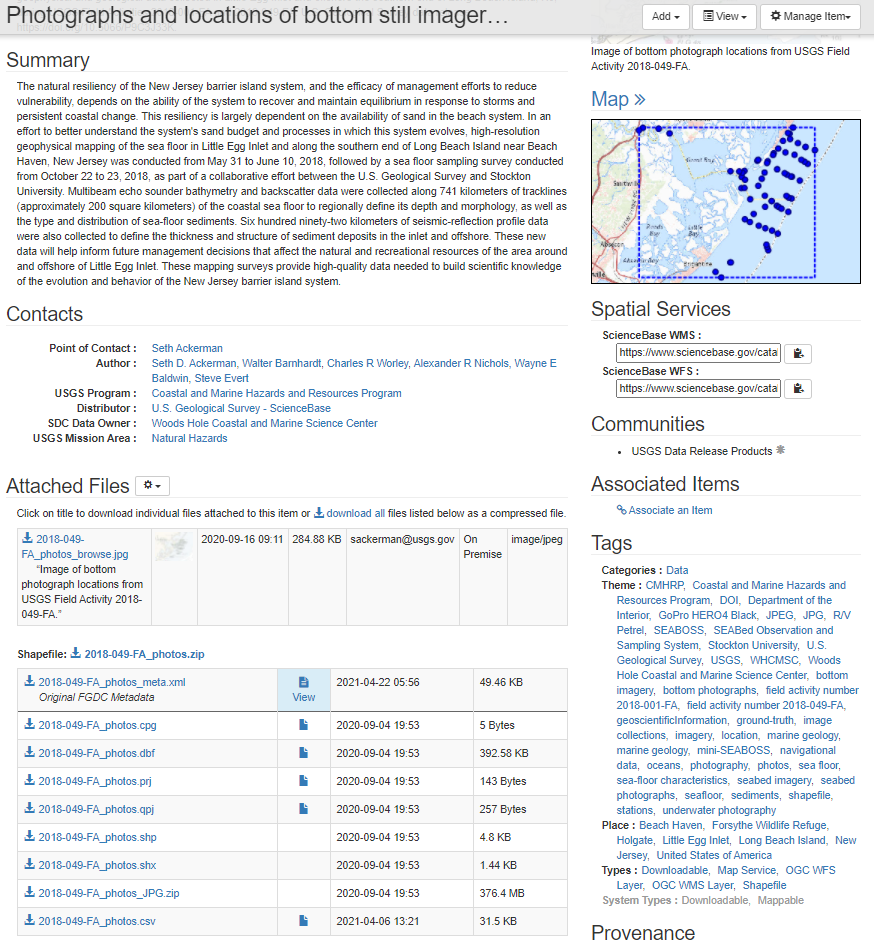
Photographs - If the photographs are observational data, they should be included in a data release in TIFF, JPG, or PNG formats. The photographs should all have EXIF metadata describing information such as date, time, location, and who took the photograph.
PDF and Word documents - PDFs and Word documents are generally discouraged in a data release. There will be additional guidance from the FSPAC on this in the near future. Currently, PDF files may be included in a data release only if: the documents have Center Director approval as appropriate for a data release; the documents do not include any new, unpublished, interpretive information; the documents are not formatted to look like USGS series reports (e.g., USGS logo, SPN stylesheets, templates, tables, figures, etc.); and the documents are Section 508 compliant.
Collections of Charts and Graphs - There are cases where authors have a large collection of charts or graphs they'd like to include in a data release because they don't fit in a publication. In these cases, they can be included in a data release provided that the underlying data used to create the charts and graphs are also available in the data release. Charts and graphs can be released as individual TIFFs, JPGs, or PNGs (open file formats) with appropriate alternative text. Alternative text should be just a short description of the chart or graph (100-140 characters maximum). Collections of charts and graphs can also be compiled into PDF documents with appropriate alternative text for each chart or graph. PDFs must pass an accessibility check to comply with Section 508 federal requirements.
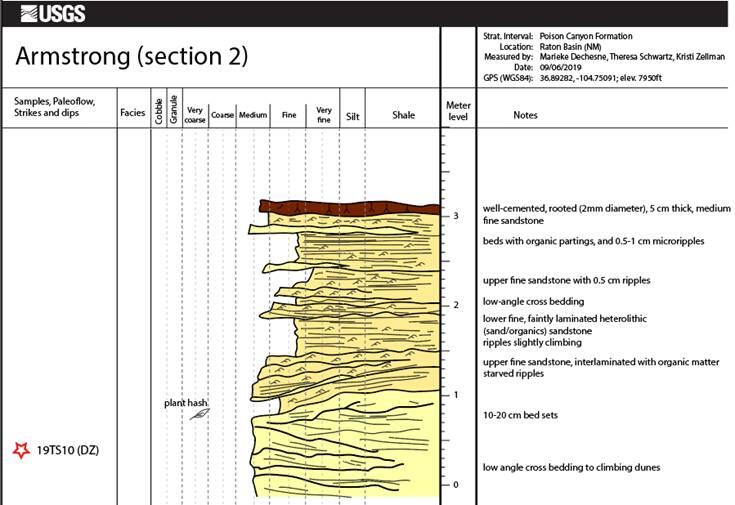
Observational data that are not in tabular or geospatial formats - Certain types of observational data, such as stratigraphic sections and geophysical soundings, are typically provided in image formats and do not have underlying raw data. These observational data should be released in a data release as TIFF, JPG, PNG, and PDF formats with alternative text and adhering to Section 508 (see above).
If authors have further questions on what should be included in a USGS data release, please contact sciencebase_datarelease@usgs.gov.
Subscribe to the ScienceBase Mailing List for Quarterly Updates.