
This page presents Kīlauea monitoring data collected over the past five years, including earthquake rates, locations, and depths and ground deformation data.
Seismic Data
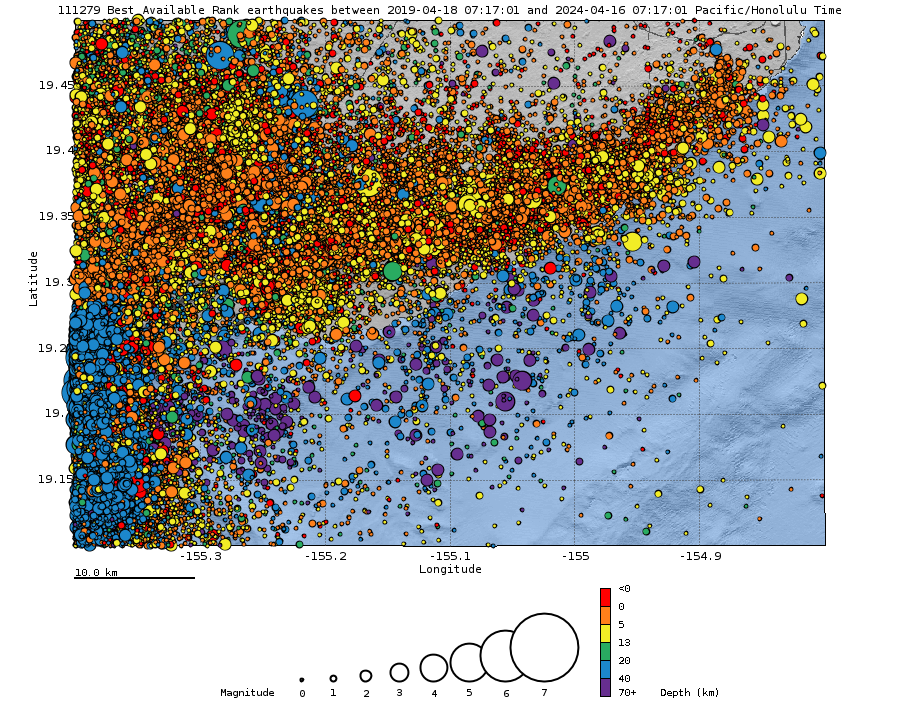
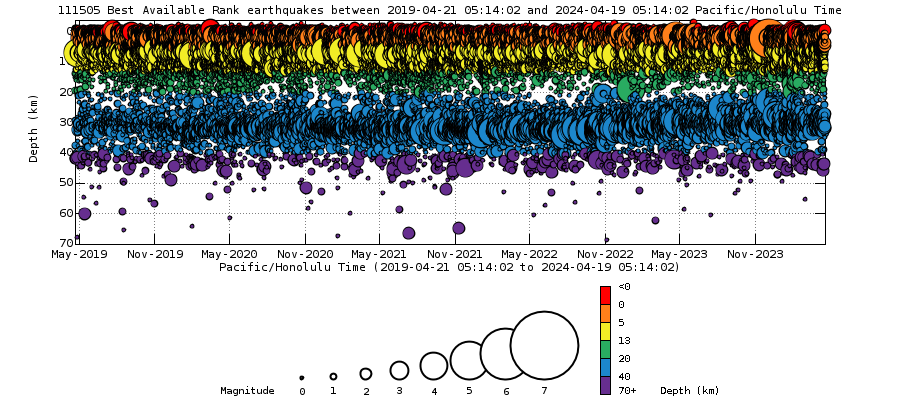
Earthquake Hypocenters Map and Cross Section - Past 5 Years

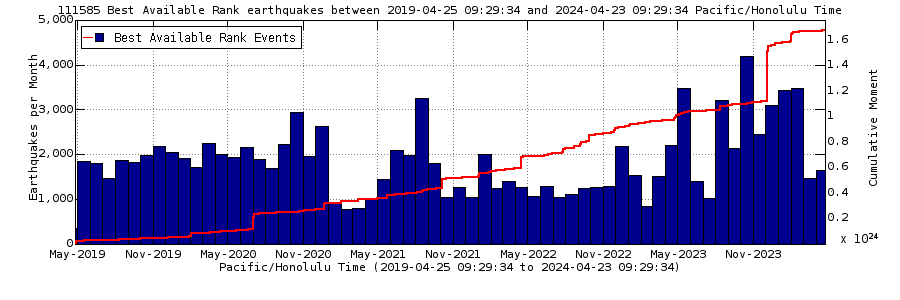
Earthquake Rates and Depths - Past 5 Years

Deformation Data
Map of Selected Deformation Stations
For more information on how electronic tiltmeters and GPS receivers help monitor the deformation of Kīlauea Volcano, see the HVO Deformation page. Data plots from additional stations are available from our interactive map. Use the right-side menu to view different types of data.
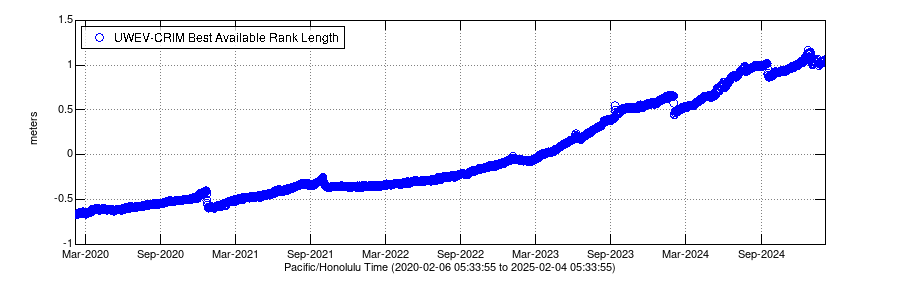
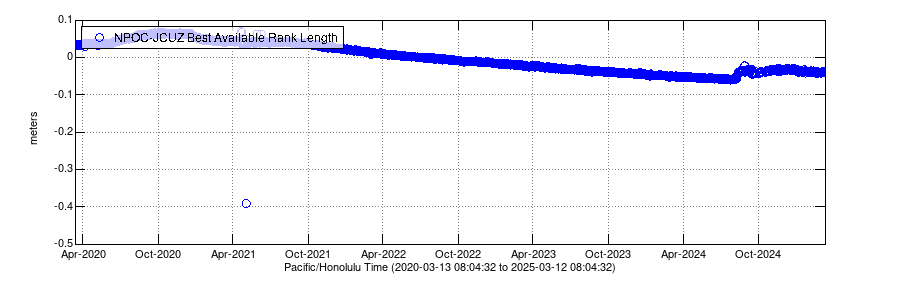
Global Positioning System - Past 5 Years
Kīlauea Summit
Middle East Rift Zone
This page presents Kīlauea monitoring data collected over the past five years, including earthquake rates, locations, and depths and ground deformation data.
Seismic Data
Earthquake Hypocenters Map and Cross Section - Past 5 Years
Earthquake Rates and Depths - Past 5 Years
Deformation Data
Map of Selected Deformation Stations
For more information on how electronic tiltmeters and GPS receivers help monitor the deformation of Kīlauea Volcano, see the HVO Deformation page. Data plots from additional stations are available from our interactive map. Use the right-side menu to view different types of data.
Global Positioning System - Past 5 Years
Kīlauea Summit
Middle East Rift Zone