
This page presents Kīlauea monitoring data collected over the past month, including summit crater floor elevation, earthquake rates, locations, and depths, ground deformation data and gas data.
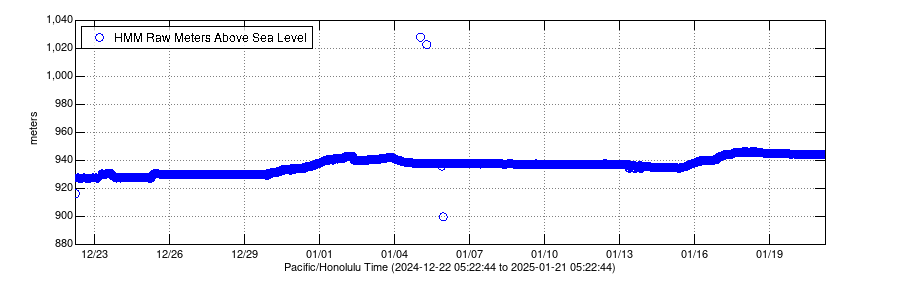
Halemaʻumaʻu crater floor elevation
Seismic Data
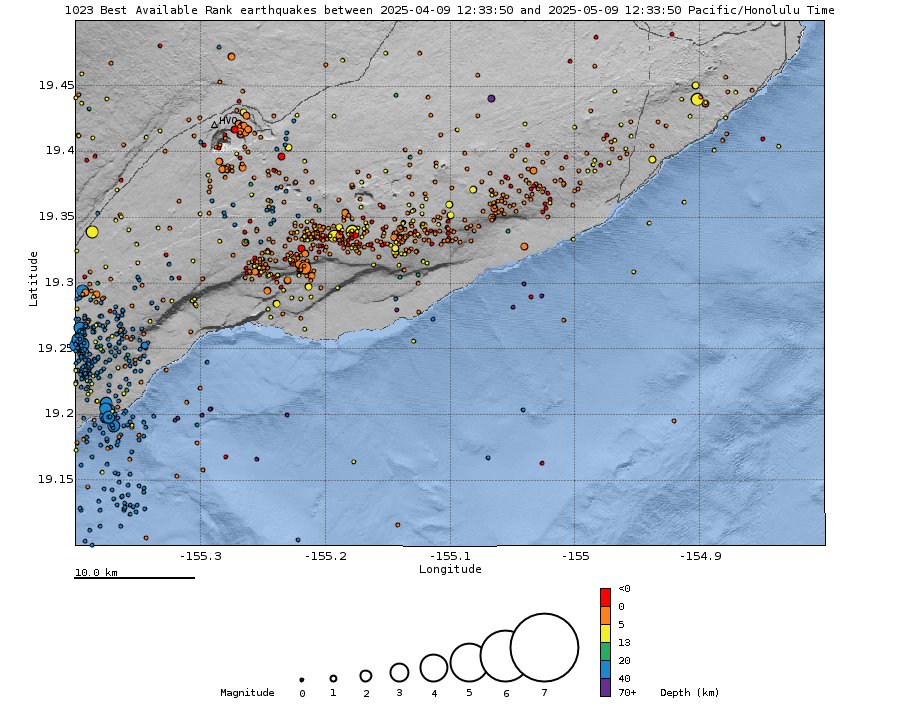
Earthquake Hypocenters Map and Cross Section - Past Month

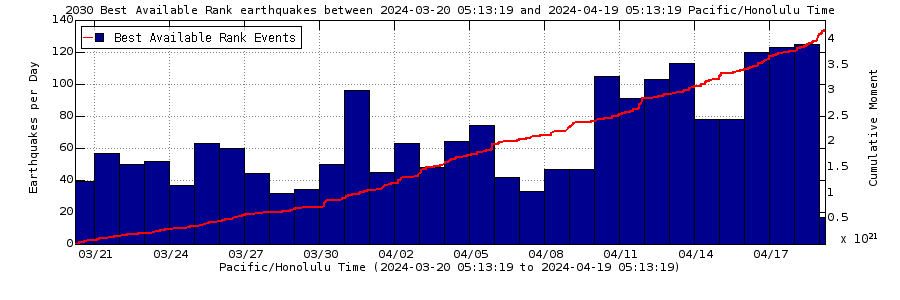
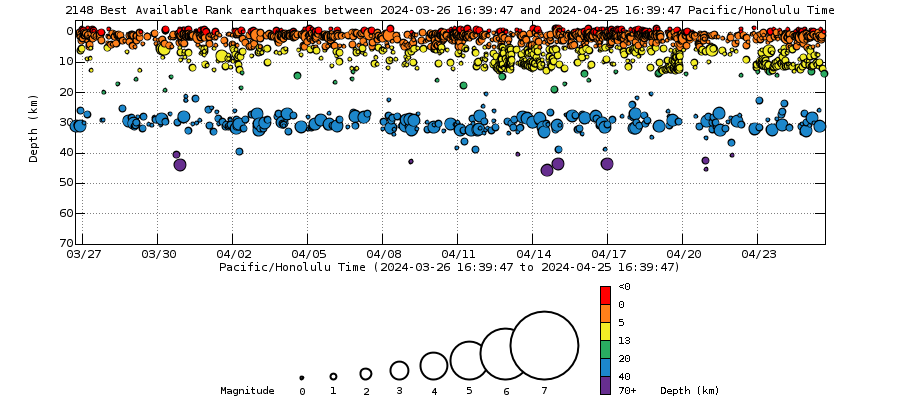
Earthquake Rates and Depths - Past Month

Deformation Data
Map of Selected Deformation Stations
For more information on how electronic tiltmeters and GPS receivers help monitor the deformation of Kīlauea Volcano, see the HVO Deformation page. Data plots from additional stations are available from our interactive map. Use the right-side menu to view different types of data.
Electronic Tiltmeter
The plots below show Electronic Tilt recorded at Kilauea Summit and East Rift Zone shown from the past month. In each plot, the blue line shows radial tilt measurements which record changes perpendicular to surface-normal, and the green line shows tangential tilt measurements which are made parallel to surface-normal. Both measurements are made in a specific direction, with tilt azimuth is expressed as 0-360 degrees from magnetic north, at each station. (See the legend in the upper left corner of each plot).
- Station UWD is located near Uēkahuna, on the western rim of Kīlauea's summit caldera.
- Station POC is located on the north rim of Pu‘u‘ō‘ō cone on the middle East Rift Zone of Kīlauea.
Positive changes often indicate inflation of the magma storage areas beneath the caldera or on the middle East Rift Zone of Kīlauea, but may also result from heavy rainfall or, occasionally, instrumental malfunctions.
Electronic Tilt at Kīlauea Summit, Station UWD - Past Month
Electronic Tilt at Kīlauea East Rift Zone, Station POC - Past Month

Global Positioning System (GPS)
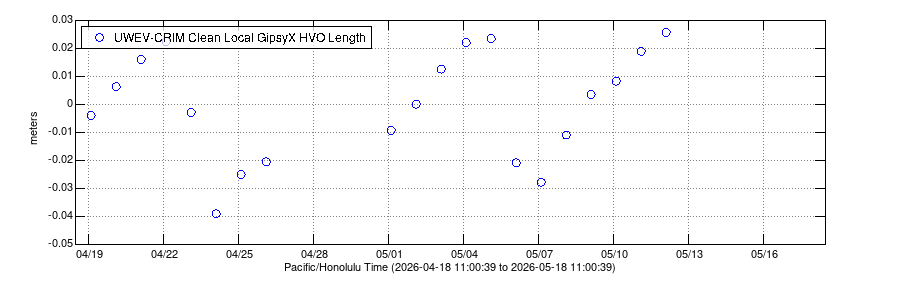
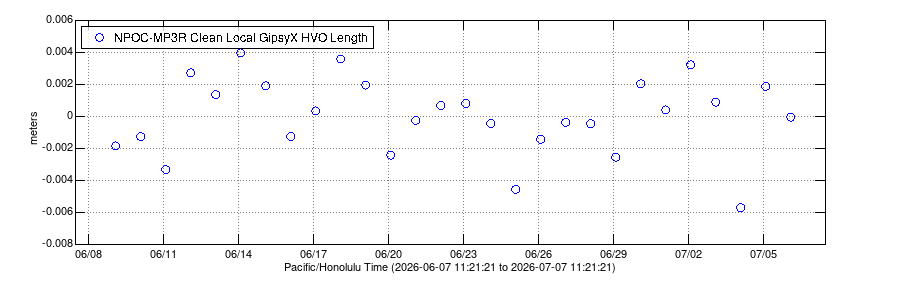
The plots below show the change in baseline distance between two Global Positioning System (GPS) stations.
- UWEV station is located on the northwest edge of Kīlauea's summit caldera. CRIM station is located directly opposite on the southern edge of Kilauea’s summit caldera.
- NPOC station is located just north of Pu‘u‘ō‘ō cone on the middle East Rift Zone of Kīlauea. MP3R station is located south of Pu‘u‘ō‘ō cone along the South Flank of Kilauea.
Positive trends in baseline length are associated with an increase in distance between the two station positions, which can typically be interpreted as inflation of the summit magma reservoir or accumulation of magma in the rift zone.
Cross-Caldera Change at Kīlauea Summit - Past 1 Month
Cross-Rift-Zone Change at Kīlauea East Rift Zone - Past 1 Month
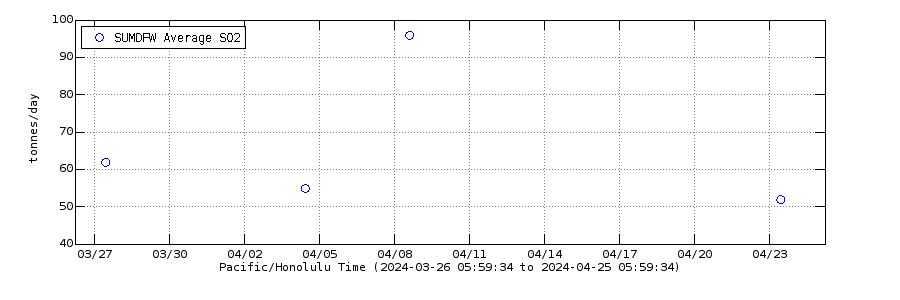
Gas Data
Sulfur dioxide emission rates - Kīlauea summit - Past Month
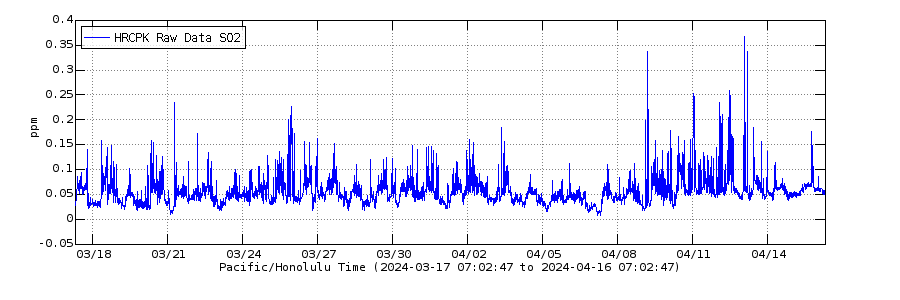
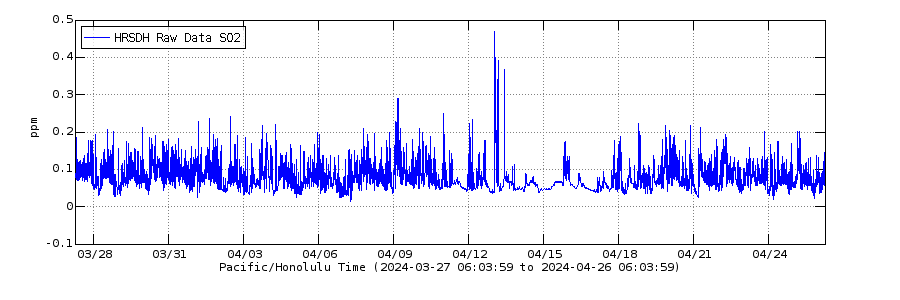
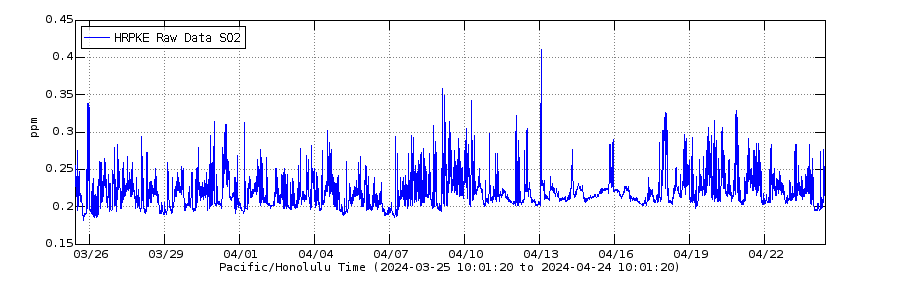
Sulfur dioxide concentration in ambient air - Kīlauea Summit - Past Month
This page presents Kīlauea monitoring data collected over the past month, including summit crater floor elevation, earthquake rates, locations, and depths, ground deformation data and gas data.
Halemaʻumaʻu crater floor elevation
Seismic Data
Earthquake Hypocenters Map and Cross Section - Past Month
Earthquake Rates and Depths - Past Month
Deformation Data
Map of Selected Deformation Stations
For more information on how electronic tiltmeters and GPS receivers help monitor the deformation of Kīlauea Volcano, see the HVO Deformation page. Data plots from additional stations are available from our interactive map. Use the right-side menu to view different types of data.
Electronic Tiltmeter
The plots below show Electronic Tilt recorded at Kilauea Summit and East Rift Zone shown from the past month. In each plot, the blue line shows radial tilt measurements which record changes perpendicular to surface-normal, and the green line shows tangential tilt measurements which are made parallel to surface-normal. Both measurements are made in a specific direction, with tilt azimuth is expressed as 0-360 degrees from magnetic north, at each station. (See the legend in the upper left corner of each plot).
- Station UWD is located near Uēkahuna, on the western rim of Kīlauea's summit caldera.
- Station POC is located on the north rim of Pu‘u‘ō‘ō cone on the middle East Rift Zone of Kīlauea.
Positive changes often indicate inflation of the magma storage areas beneath the caldera or on the middle East Rift Zone of Kīlauea, but may also result from heavy rainfall or, occasionally, instrumental malfunctions.
Electronic Tilt at Kīlauea Summit, Station UWD - Past Month
Electronic Tilt at Kīlauea East Rift Zone, Station POC - Past Month
Global Positioning System (GPS)
The plots below show the change in baseline distance between two Global Positioning System (GPS) stations.
- UWEV station is located on the northwest edge of Kīlauea's summit caldera. CRIM station is located directly opposite on the southern edge of Kilauea’s summit caldera.
- NPOC station is located just north of Pu‘u‘ō‘ō cone on the middle East Rift Zone of Kīlauea. MP3R station is located south of Pu‘u‘ō‘ō cone along the South Flank of Kilauea.
Positive trends in baseline length are associated with an increase in distance between the two station positions, which can typically be interpreted as inflation of the summit magma reservoir or accumulation of magma in the rift zone.
Cross-Caldera Change at Kīlauea Summit - Past 1 Month
Cross-Rift-Zone Change at Kīlauea East Rift Zone - Past 1 Month
Gas Data
Sulfur dioxide emission rates - Kīlauea summit - Past Month
Sulfur dioxide concentration in ambient air - Kīlauea Summit - Past Month