
Past week monitoring data for Mauna Loa.
Seismic Data
Earthquake Hypocenters Map and Cross Section - Past Week
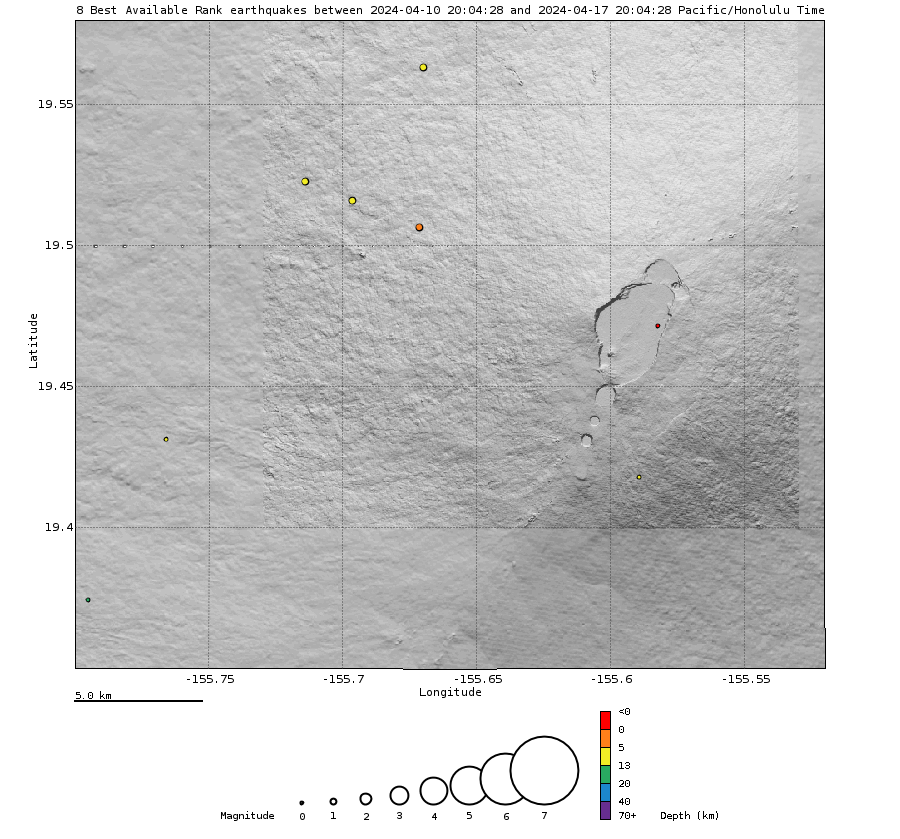

Above Top: Map showing locations of earthquakes during the past week. Bottom: Depth of earthquakes (circles) during the past week. Depth is reported relative to sea level, which is equal to a depth of zero on the above plot. Circle-size represents magnitude, and color indicates depth. An interactive earthquake plot can be found on the HVO Earthquakes page.
Earthquake Rates and Depths - Past Week
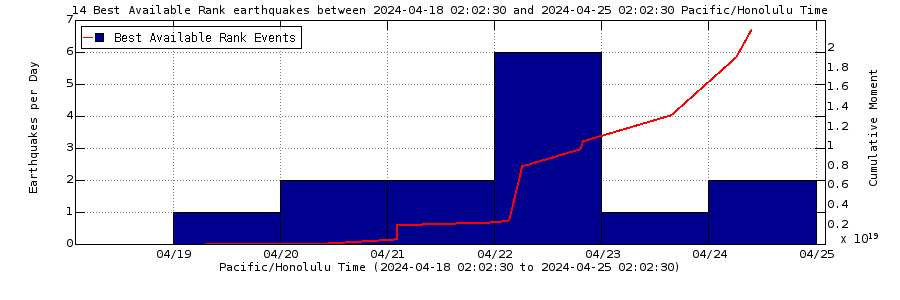

Above Top: Number of earthquakes per day during the past week (blue bars). The red line is the cumulative moment (energy) release. Bottom: Depth of earthquakes during the past week in the area shown on the map above. Depth is reported relative to sea level, which is equal to a depth of zero on the above plot. On both figures, circle-size represents magnitude, and color indicates depth. An interactive earthquake plot can be found on the HVO Earthquakes page.
Deformation Data
Electronic Tilt at Mauna Loa Summit - Past Week
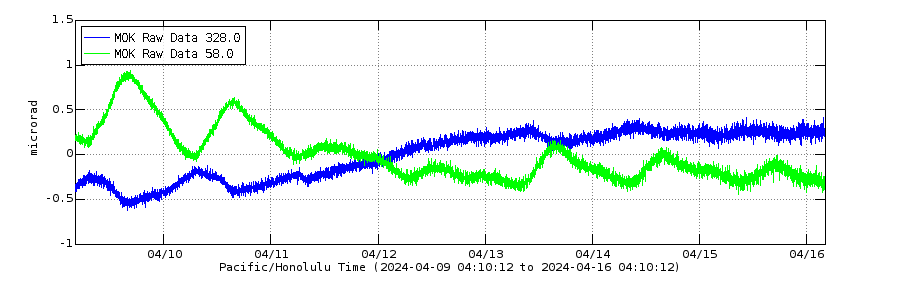
Above: Tilt data from a site near the northwest rim of Mauna Loa's summit caldera. The tiltmeter responds to daily and seasonal temperature fluctuations as well as possible changes in Mauna Loa's magma storage system.
Map of Selected Deformation Stations

For more information on how electronic tiltmeters and GPS receivers help monitor the deformation of Mauna Loa Volcano, see the HVO Deformation page.
Related Information
-

Past 5 Years Monitoring Data for Mauna Loa
Seismic and deformation monitoring data.-
Past Year Monitoring Data for Mauna Loa
Seismic and deformation monitoring data. -
Past Month Monitoring Data for Mauna Loa
Seismic and deformation monitoring data. 
Monitoring Data for Mauna Loa
For more information on how electronic tiltmeters and GPS receivers help monitor the deformation of Kīlauea Volcano, see the HVO Deformation page.
Monitoring Data for Mauna Loa
Past Month Monitoring Data for Mauna Loa
Past Year Monitoring Data for Mauna Loa
Past 5 Years Monitoring Data for Mauna Loa
Past week monitoring data for Mauna Loa.
Seismic Data
Earthquake Hypocenters Map and Cross Section - Past Week
Above Top: Map showing locations of earthquakes during the past week. Bottom: Depth of earthquakes (circles) during the past week. Depth is reported relative to sea level, which is equal to a depth of zero on the above plot. Circle-size represents magnitude, and color indicates depth. An interactive earthquake plot can be found on the HVO Earthquakes page.
Earthquake Rates and Depths - Past Week
Above Top: Number of earthquakes per day during the past week (blue bars). The red line is the cumulative moment (energy) release. Bottom: Depth of earthquakes during the past week in the area shown on the map above. Depth is reported relative to sea level, which is equal to a depth of zero on the above plot. On both figures, circle-size represents magnitude, and color indicates depth. An interactive earthquake plot can be found on the HVO Earthquakes page.
Deformation Data
Electronic Tilt at Mauna Loa Summit - Past Week
Above: Tilt data from a site near the northwest rim of Mauna Loa's summit caldera. The tiltmeter responds to daily and seasonal temperature fluctuations as well as possible changes in Mauna Loa's magma storage system.
Map of Selected Deformation Stations
For more information on how electronic tiltmeters and GPS receivers help monitor the deformation of Mauna Loa Volcano, see the HVO Deformation page.
Related Information
-
-
Past 5 Years Monitoring Data for Mauna Loa
Seismic and deformation monitoring data. -
Past Year Monitoring Data for Mauna Loa
Seismic and deformation monitoring data. -
Past Month Monitoring Data for Mauna Loa
Seismic and deformation monitoring data. -
Monitoring Data for Mauna Loa
For more information on how electronic tiltmeters and GPS receivers help monitor the deformation of Kīlauea Volcano, see the HVO Deformation page.
Monitoring Data for Mauna Loa
Past Month Monitoring Data for Mauna Loa
Past Year Monitoring Data for Mauna Loa