
Earth Science Week 2021 Calendar Activity
We drink water every day – we can’t live without it! About 70% of Earth’s surface is covered by water, but how much of Earth’s water is actually drinkable (liquid freshwater that is not salty or frozen)?
Materials
- Globe or world map
- Water cycle diagram
- 100 gummy bears or any other candy, food, or items that can be cut
- Plastic knife or scissors, depending on the type of items
- Internet access to find the key for your model and additional resources about Earth’s water
Procedure
Imagine that all the water on Earth is represented by 100 gummy bears (or another type of item) and that each bear represents one percent (1%) of Earth’s total water.

Step 1 – What do you think? On your own or in a group, do your best to split the bears into two piles – one to represent all of Earth’s water that you think that is salty and the other to represent all freshwater on Earth, including ice.
Step 2 – Next, divide your freshwater pile of bears into two smaller piles – one that you think represents all the freshwater that is frozen and one pile that shows all the freshwater that is liquid. If you want to go even further, you can even try to split your liquid freshwater reservoir to show how much of that water is under the Earth’s surface (groundwater) vs. on the surface (rivers, lakes, streams).
Step 3 - You have made a model of Earth’s water cycle reservoirs. Take a photo of your model. Scroll down to the bottom of this page to see an example of the completed “salty versus freshwater” model and the data from the USGS Water Science School page used to adjust your model if necessary. You will also find details about the water cycle (diagram available in 60+ languages) and learn about the reservoirs and pathways of water on Earth. We would love to see your model! Show us by tagging us on social media @USGS_YES and #saltyvsfreshwater #earthscienceweek2021.
Step 4 – Discuss what you learned and how the amount of freshwater on Earth is important to you and to life on Earth!
Extensions (optional) –
1 - Do you know where the water in your home comes from?
2 - What do you think happens to the different water reservoirs to keep them in balance?
3 - Earth is unique in our solar system in that water can exist in all three phases of matter (solid, liquid, and gas). Research other planets in our solar system to discover which planets have the right temperature and/or atmospheric pressure ranges to allow water to be stable at solids, liquids, or gaseous states.
Next Generation Science Standards (NGSS) Connections
K-LS1-1: Use observations to describe patterns of what plants and animals (including humans) need to survive.
5-ESS2-2: Describe and graph the amounts of salt water and fresh water in various reservoirs to provide evidence about the distribution of water on Earth.
MS-ESS2-2: Develop a model to describe the cycling of water through Earth's systems driven by energy from the sun and the force of gravity.
Scroll down for the Water Reservoirs Key (no peeking until your model is complete)…
Keep scrolling...
Earth's Water Cycle Reservoirs Key:
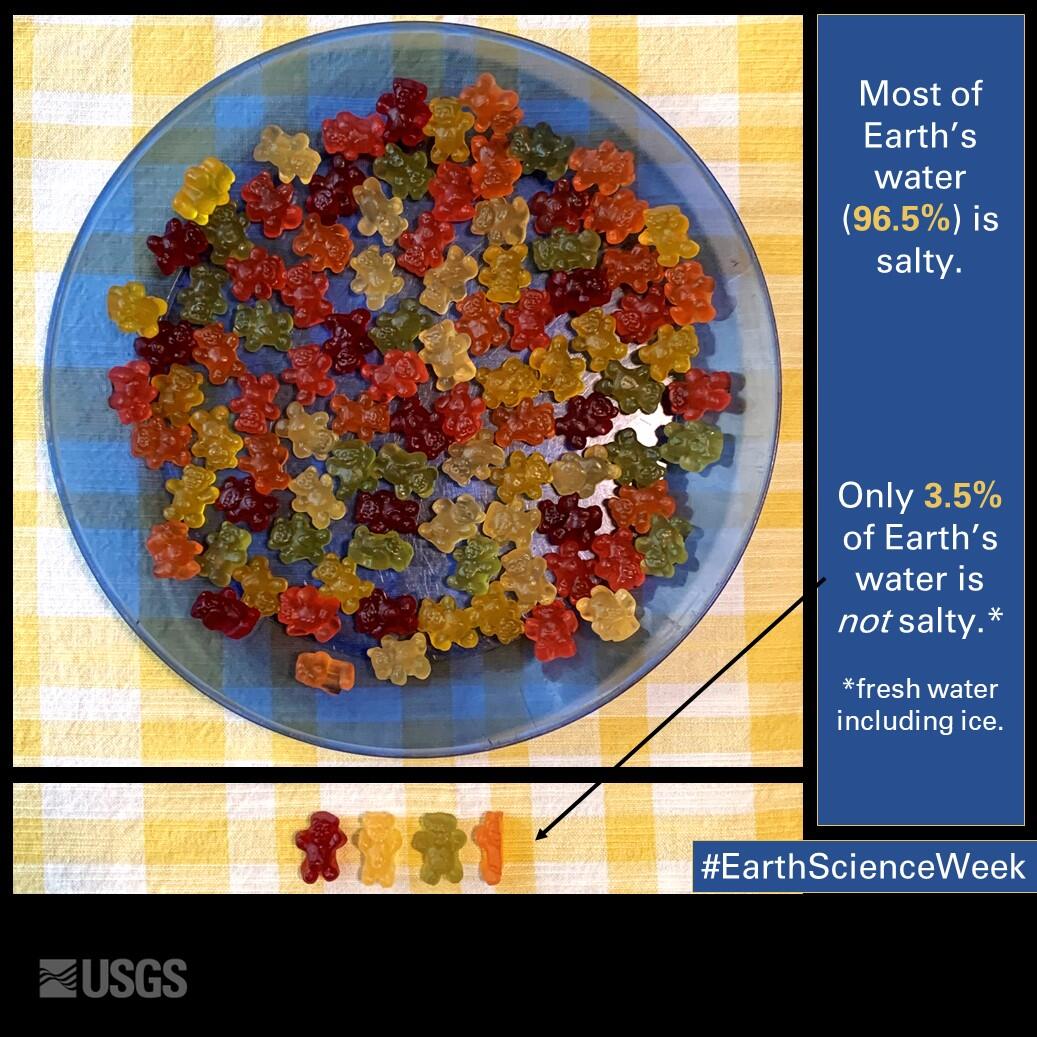
- Although water covers about 70% of Earth’s surface, the amount of salty water on Earth is actually 96.5% (including oceans, seas, and bays), represented by the bears that are still on the plate. Remember, the oceans are VERY DEEP and hold most of Earth’s water!
- The bears on the tablecloth represent the percentage of Earth’s water that is NOT salty (3.5%).
- Next, if you wanted to split up the 3.5 freshwater bears to show how much of Earth’s fresh water is frozen vs. not frozen (liquid), the frozen pile would have 2.4 of the 3.5 bears (68.7% of Earth’s freshwater is frozen) and the liquid pile would have 1.1 of the 3.5 bears (31.3% of Earth’s freshwater is liquid).

- Advanced Students: If you wanted to go even further, you could divide the freshwater pile into piles (or tiny parts of bears) to represent groundwater (the largest pile), rivers, lakes, water vapor, and other reservoirs. Visit the USGS Water Science School for additional information. As you will likely discover, the individual reservoirs of liquid freshwater are very small, and that subdividing small items is quite challenging, especially when using sticky items such as gummy bears.