



Figure 1: Bar graph showing 3D Elevation Program data acquisition from Federal and non-Federal investments for fiscal years 2015 - 2025.
Images
3D National Topography Model images.
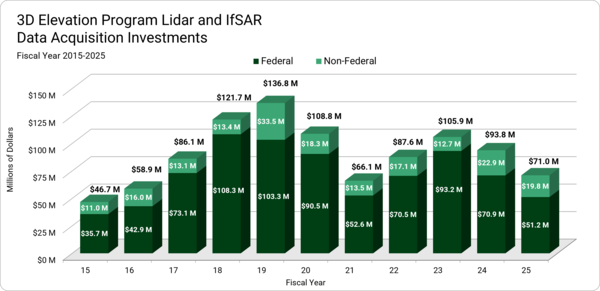
Figure 1 - 3DEP Investments
Figure 1: Bar graph showing 3D Elevation Program data acquisition from Federal and non-Federal investments for fiscal years 2015 - 2025.
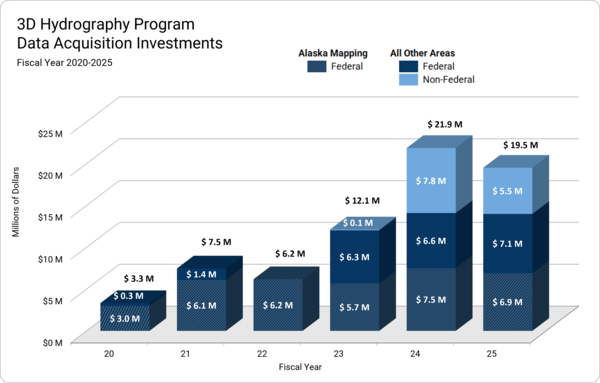
Figure 2 - 3DHP Investments
Figure 2: Bar graph showing 3D Hydrography Program data acquisition from Federal and non-Federal investments for fiscal years 2020 - 2025.
Figure 2: Bar graph showing 3D Hydrography Program data acquisition from Federal and non-Federal investments for fiscal years 2020 - 2025.
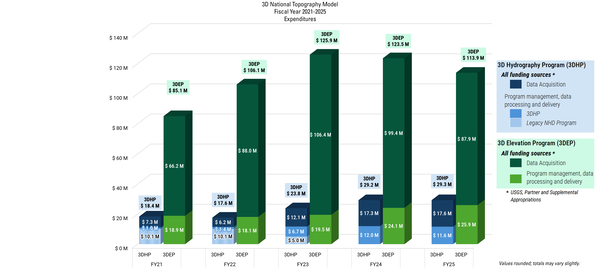
3DNTM Expenditures - Simplified
Figure 3: Bar graph showing 3D Hydrography Program and 3D Elevation Program fiscal year 2020-2025 expenditures.
Community-wide 3DEP Expenditures Include:
Figure 3: Bar graph showing 3D Hydrography Program and 3D Elevation Program fiscal year 2020-2025 expenditures.
Community-wide 3DEP Expenditures Include:
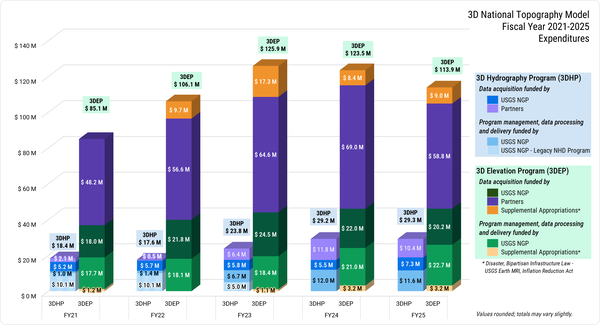
3DNTM Expenditures
Figure 3: Bar graph showing 3D Hydrography Program and 3D Elevation Program fiscal year 2020-2025 expenditures.
Community-wide 3DEP Expenditures Include:
Figure 3: Bar graph showing 3D Hydrography Program and 3D Elevation Program fiscal year 2020-2025 expenditures.
Community-wide 3DEP Expenditures Include:
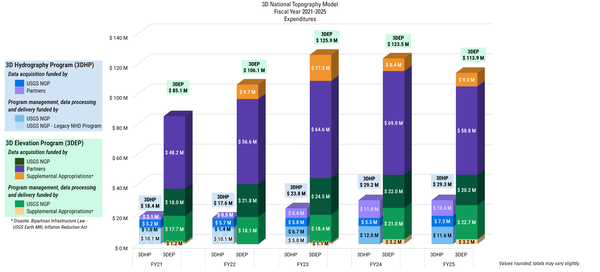
3DNTM Expenditures - Detailed
Figure 3: Bar graph showing 3D Hydrography Program and 3D Elevation Program fiscal year 2020-2025 expenditures.
Community-wide 3DEP Expenditures Include:
Figure 3: Bar graph showing 3D Hydrography Program and 3D Elevation Program fiscal year 2020-2025 expenditures.
Community-wide 3DEP Expenditures Include:
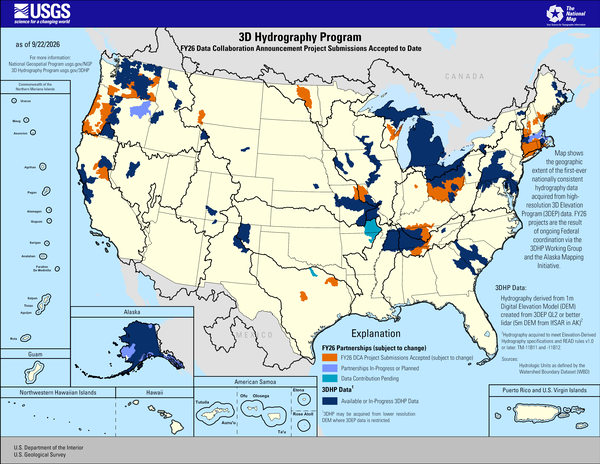
3D Hydrography Program FY26 DCA Project Submissions Accepted to Date
3D Hydrography Program FY26 DCA Project Submissions Accepted to DateThis map of the United States and its territories shows geographic extent of the first-ever nationally consistent hydrography data acquired from high-resolution 3D Elevation Program (3DEP) data. FY26 projects are the result of ongoing Federal coordination via the 3DHP Working Group and the Alaska Mapping Initiative.
Sources/Usage
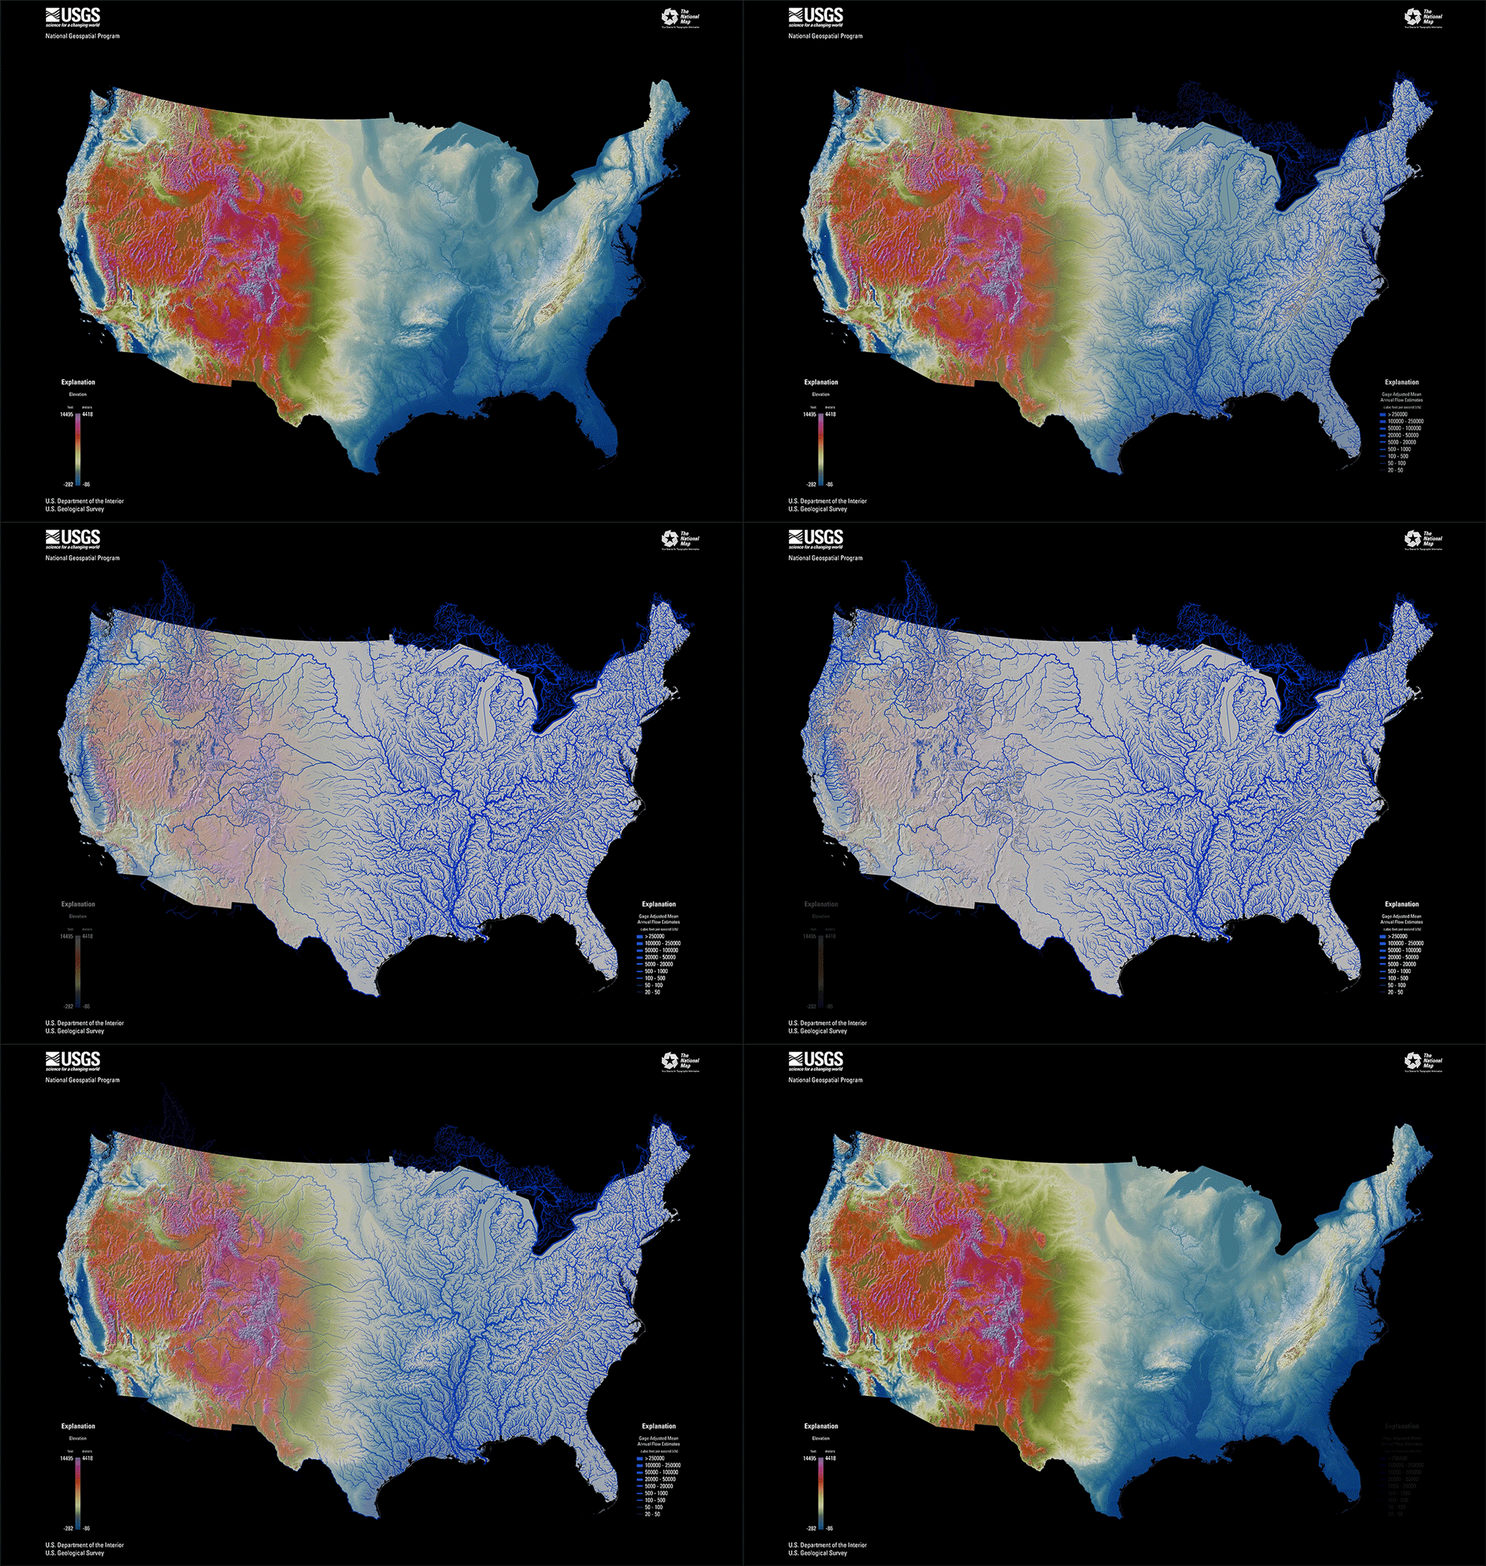
CONUS Elevation and Hydrography Animation
CONUS elevation map in bright, vibrant colors with purple as highest elevation and blue as lowest elevation and the hydrography map with larger annual flow volumes as thicker lines.
CONUS elevation map in bright, vibrant colors with purple as highest elevation and blue as lowest elevation and the hydrography map with larger annual flow volumes as thicker lines.
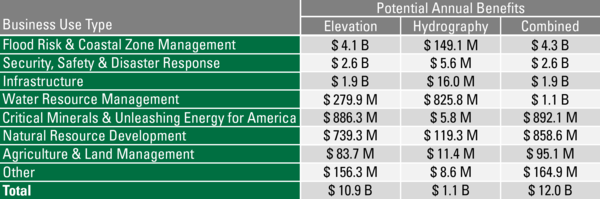
3DTNM Potential Annual Benefits
Potential Annual Benefits by Business Use Type for Elevation and Hydrography Data if all needs are met.
Potential Annual Benefits by Business Use Type for Elevation and Hydrography Data if all needs are met.

3DHP Map FY24 Partnerships and DCA Projects
This map of the United States and its territories shows geographic extent of the first-ever nationally consistent hydrography data acquired from high-resolution 3D Elevation Program (3DEP) data.
This map of the United States and its territories shows geographic extent of the first-ever nationally consistent hydrography data acquired from high-resolution 3D Elevation Program (3DEP) data.

3DEP Map FY24 Partnerships and DCA Projects
This map of the United States and its territories shows geographic extent of completion of the first-ever national baseline of consistent high-resolution elevation data - both bare earth and 3D point clouds.
This map of the United States and its territories shows geographic extent of completion of the first-ever national baseline of consistent high-resolution elevation data - both bare earth and 3D point clouds.

3DHP Figure 3 3D National Topography Model visualization
3DHP Figure 3 3D National Topography Model visualization3D terrain profile visualizes the surface elevations and hydrologic features along a horizontal plane.
3DHP Figure 3 3D National Topography Model visualization
3DHP Figure 3 3D National Topography Model visualization3D terrain profile visualizes the surface elevations and hydrologic features along a horizontal plane.

Scientist at the Core Research Center slabs rock cores
Scientist at the Core Research Center slabs rock coresA USGS scientist at the Core Research Center cuts a rock core with a saw and places the cores into boxes.
Scientist at the Core Research Center slabs rock cores
Scientist at the Core Research Center slabs rock coresA USGS scientist at the Core Research Center cuts a rock core with a saw and places the cores into boxes.