
USGS develops novel approach to assess efficiency of stormwater management practices
Issue: Urban stormwater runoff is a rapidly increasing source of pollutants to Chesapeake Bay. It contributes on average 16 percent of the nitrogen, 16 percent of the phosphorus, and 25 percent of the sediment load to the bay annually. Urban stormwater best management practices (BMPs) (fig. 1) have been used in an effort to reduce the volume and improve the quality of stormwater runoff entering streams in the bay watershed and, ultimately, the bay. Traditional BMP design focuses primarily on flood control and spatially centralized stormwater treatment; however, this approach increases pollutant loads to streams during storm events, bypassing opportunities for pollutant removal on the landscape.

More recently, BMPs have been implemented in a low impact development (LID) manner to treat stormwater runoff nearer to its source. LID BMP design aims to maintain natural areas, promote infiltration, and improve water quality. LID BMPs are commonly implemented in networks, or treatment trains (a series of connected BMPs), to provide spatially distributed stormwater treatment and more closely reproduce the volume and rate of runoff in an undeveloped landscape.
The USGS developed a novel BMP model to quantify and compare the pollutant removal efficiencies on a watershed scale in two urban watersheds in Maryland with different BMP spatial design patterns (traditional and LID). An estimate of uncertainty was included in the modeling framework by using ranges for BMP pollutant removal efficiencies that were compiled from previously published studies. The results are in the journal article "Modeling watershed-scale impacts of stormwater management with traditional versus low impact development design" (Sparkman and others, 2017).
Key Findings
For the two watersheds studied, simulation results show that the LID watershed removed pollutants more effectively than the traditional watershed. Results of the model show that the BMPs in the LID watershed removed approximately an additional—
- 78 kilograms (kg) nitrogen,
- 3 kg phosphorus, and
- 1,592 kg sediment
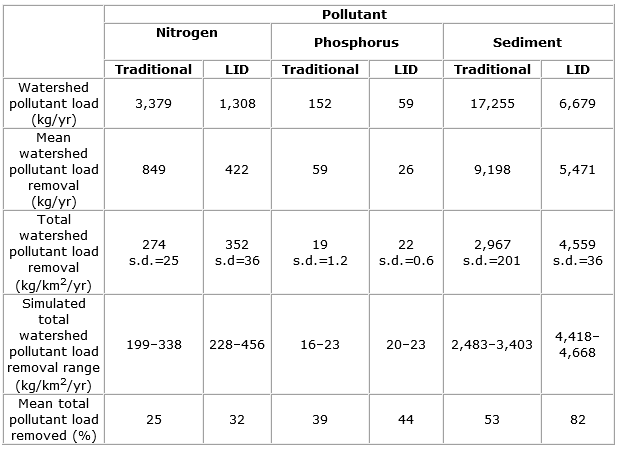
per square kilometer per year (a 7-, 5-, and 29-percent increase in mean total pollutant load removed, respectively) compared to the BMPs in the traditional watershed (table 1, fig. 2).
Table 1. Predicted average nitrogen, phosphorus, and sediment removal in a traditional and a low impact development (LID) watershed in Maryland.
[kg/yr, kilograms per year; kg/km2/yr, kilograms per square kilometer per year; s.d., standard deviation; %, percent]
Implications for Management Policies and Practices and Next Steps
- This approach included the development of a novel BMP model to compare traditional and LID design, pioneering the use of comprehensively digitized storm-sewer infrastructure and BMP design connectivity with spatial patterns in a geographic information system at the watershed scale (fig. 3). This approach can be used by planners to prioritize watersheds for BMP design on the basis of simulation results or can be used to optimize BMP selection.
- The new approach highlights the need for field-based BMP monitoring to more accurately constrain the range of BMP pollutant removal efficiencies.
- The next research objective is to incorporate costs into the model to estimate the relation between water-quality benefits and resources expended.
Source of Information
The USGS findings described in this Science Summary are available by accessing the document below, which should be used as the reference for this information:
Sparkman, S.A., Hogan, D.M., Hopkins, K.G., and Loperfido, J.V., 2017, Modeling watershed-scale impacts of stormwater management with traditional versus low impact development design: Journal of the American Water Resources Association, https://doi.org/10.1111/1752-1688.12559.


« Return to Chesapeake Bay Activities — Home
Issue: Urban stormwater runoff is a rapidly increasing source of pollutants to Chesapeake Bay. It contributes on average 16 percent of the nitrogen, 16 percent of the phosphorus, and 25 percent of the sediment load to the bay annually. Urban stormwater best management practices (BMPs) (fig. 1) have been used in an effort to reduce the volume and improve the quality of stormwater runoff entering streams in the bay watershed and, ultimately, the bay. Traditional BMP design focuses primarily on flood control and spatially centralized stormwater treatment; however, this approach increases pollutant loads to streams during storm events, bypassing opportunities for pollutant removal on the landscape.
More recently, BMPs have been implemented in a low impact development (LID) manner to treat stormwater runoff nearer to its source. LID BMP design aims to maintain natural areas, promote infiltration, and improve water quality. LID BMPs are commonly implemented in networks, or treatment trains (a series of connected BMPs), to provide spatially distributed stormwater treatment and more closely reproduce the volume and rate of runoff in an undeveloped landscape.
The USGS developed a novel BMP model to quantify and compare the pollutant removal efficiencies on a watershed scale in two urban watersheds in Maryland with different BMP spatial design patterns (traditional and LID). An estimate of uncertainty was included in the modeling framework by using ranges for BMP pollutant removal efficiencies that were compiled from previously published studies. The results are in the journal article "Modeling watershed-scale impacts of stormwater management with traditional versus low impact development design" (Sparkman and others, 2017).
Key Findings
For the two watersheds studied, simulation results show that the LID watershed removed pollutants more effectively than the traditional watershed. Results of the model show that the BMPs in the LID watershed removed approximately an additional—
- 78 kilograms (kg) nitrogen,
- 3 kg phosphorus, and
- 1,592 kg sediment
per square kilometer per year (a 7-, 5-, and 29-percent increase in mean total pollutant load removed, respectively) compared to the BMPs in the traditional watershed (table 1, fig. 2).
Table 1. Predicted average nitrogen, phosphorus, and sediment removal in a traditional and a low impact development (LID) watershed in Maryland.
[kg/yr, kilograms per year; kg/km2/yr, kilograms per square kilometer per year; s.d., standard deviation; %, percent]
Implications for Management Policies and Practices and Next Steps
- This approach included the development of a novel BMP model to compare traditional and LID design, pioneering the use of comprehensively digitized storm-sewer infrastructure and BMP design connectivity with spatial patterns in a geographic information system at the watershed scale (fig. 3). This approach can be used by planners to prioritize watersheds for BMP design on the basis of simulation results or can be used to optimize BMP selection.
- The new approach highlights the need for field-based BMP monitoring to more accurately constrain the range of BMP pollutant removal efficiencies.
- The next research objective is to incorporate costs into the model to estimate the relation between water-quality benefits and resources expended.
Source of Information
The USGS findings described in this Science Summary are available by accessing the document below, which should be used as the reference for this information:
Sparkman, S.A., Hogan, D.M., Hopkins, K.G., and Loperfido, J.V., 2017, Modeling watershed-scale impacts of stormwater management with traditional versus low impact development design: Journal of the American Water Resources Association, https://doi.org/10.1111/1752-1688.12559.
« Return to Chesapeake Bay Activities — Home