
Watershed Boundry Dataset
Hydrologic Units for South Dakota in Google Earth
Completed
By Dakota Water Science Center
September 21, 2017
Project Period: 2009
Cooperator: Hyde County Conservation District, South Dakota Association of Conservation Districts
Project Chief: Ryan Thompson
Executive Summary
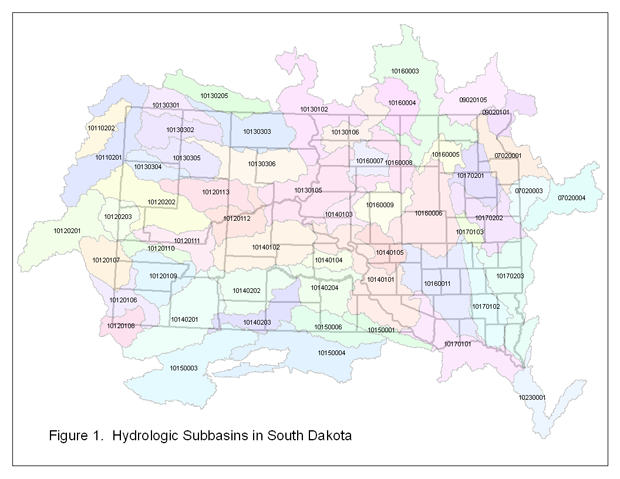
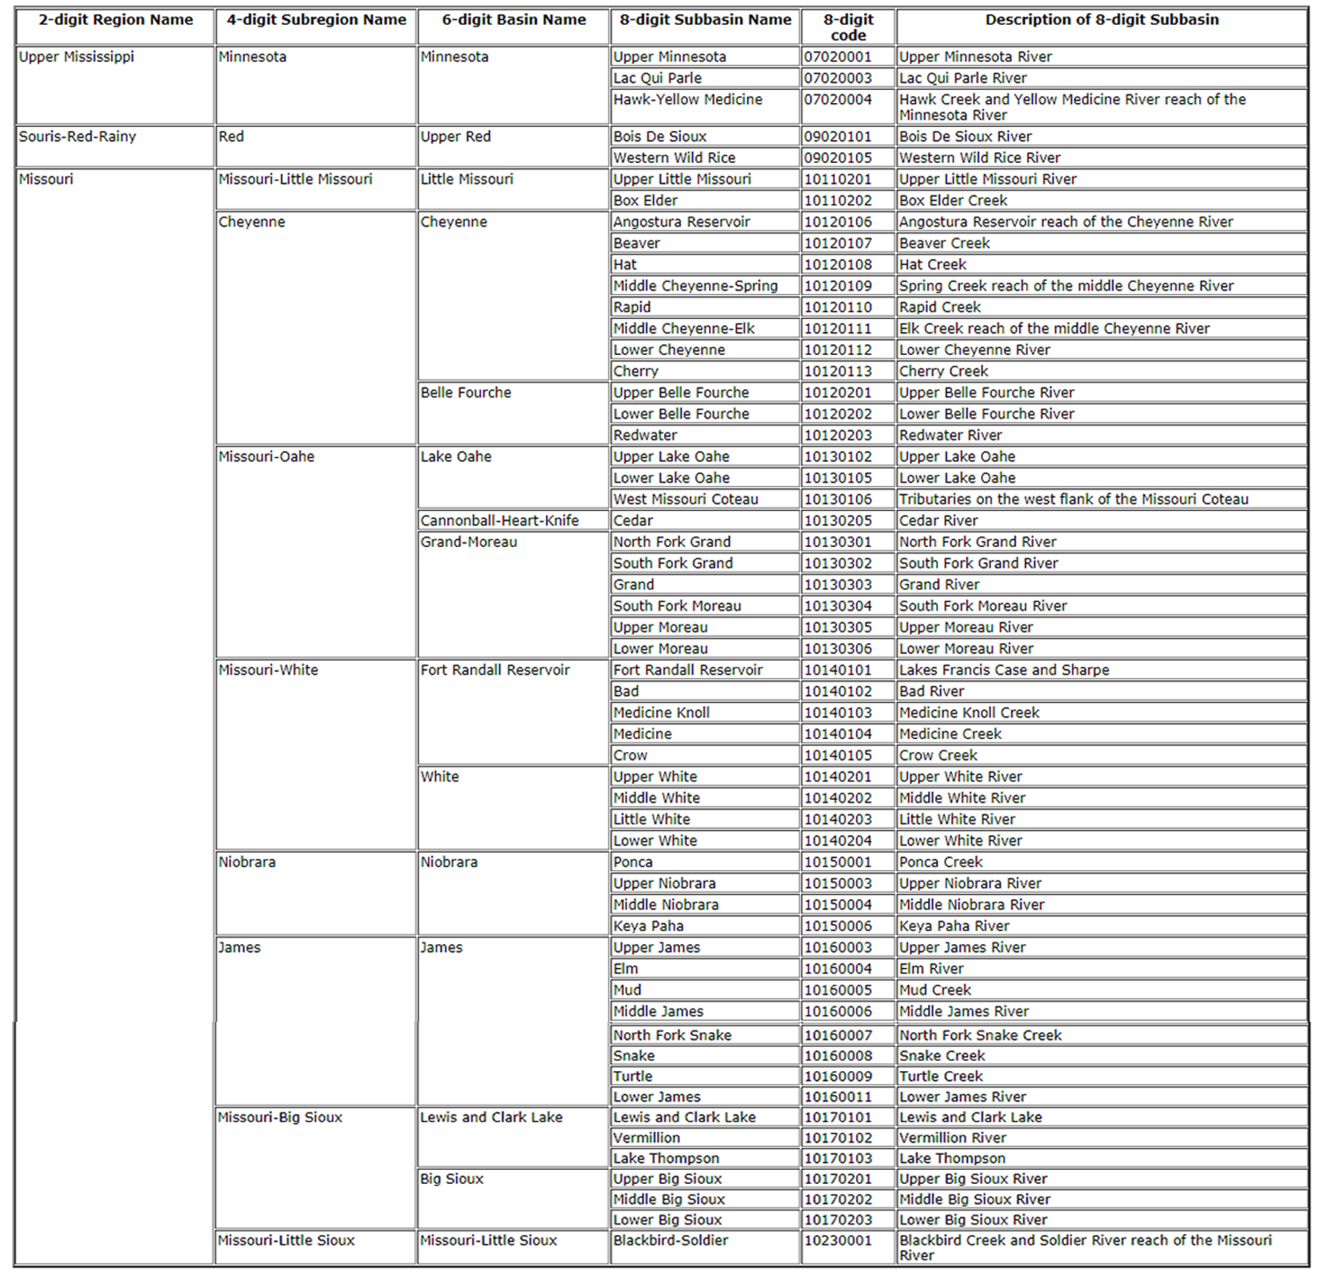
A drainage area is a specific area of land defined by topography, which drains to a specific point. A hydrologic unit is a specific drainage area that has been included in a “nested” system for numbering and cataloguing of streams and drainage areas. Different levels of hydrologic units can be defined with a nested structure to provide more detailed drainage maps. To describe which land areas are drained by a given drainage system, the United States has been mapped into 21 different hydrologic regions. Each of these regions has a two-digit numeric code assigned to it. Portions of three different hydrologic regions are found within South Dakota. Part of extreme northeastern South Dakota is in region 09, the Souris-Red-Rainy, which ultimately drains to the Hudson Bay. Another part of northeastern South Dakota is within region 07, the Upper Mississippi. By far the largest portion of South Dakota is in hydrologic region 10, the Missouri. Each region is further divided into subregions, which inherit the two-digit number code of their parent region, plus their own two digits. Additional levels of detail divide the subregions into basins, and two more digits are added to their codes. Basins have been further divided into subbasins and assigned two more digits, giving them an 8-digit code. Figure 1 shows the subbasins within and near South Dakota, and their 8-digit codes. Table 1 provides a description of these subbasins, and shows how each is nested within a basin, subregion, and region.
Recently, the Watershed Boundary Dataset, or WBD, was completed for the United States. The WBD further subdivided 8-digit subbasins into watersheds with 10-digit codes and subwatersheds with 12-digit codes. The final product of the WBD consists of electronic drainage area and boundary data layers for use in geographic information system (GIS) software. More information on the WBD in South Dakota can be found on the project page for the South Dakota WBD. Because of the scale and level of detail inherent in the WBD, publishing a paper map product was not practical. Although the GIS format of the WBD makes it well-suited to mapping and spatial analysis, it is not necessarily readily accessible to individuals without access to GIS software. Landowners, individuals responsible for or interested in the implementation of conservation and watershed management programs, individuals within educational institutions, and the general public may not be able to use the WBD in its native format to learn more about their watershed and ecosystem. In order to make the WBD available to a wider audience, the U.S. Geological Survey has developed this internet resource page in cooperation with the Hyde County Conservation District and the South Dakota Association of Conservation Districts.
In recent years, public domain software such as Google Earth has made it possible for anyone with internet access to view maps and high-resolution imagery of the earth’s surface. Converting the WBD GIS data layers to a Keyhole Markup Language (kml) file makes them available as data layers that may be displayed in Google Earth. Users need only download a free copy of Google Earth software to a home computer or access a computer at a public library or other location that already has Google Earth installed. A kmz file (zipped kml file) of the WBD downloaded from this site may then be opened in Google Earth.
For those unfamiliar with Google Earth, a brief orientation may be helpful. A menu bar is located along the top of the Google Earth window. An area called the sidebar can be displayed on the left side of the window by placing a check next to the sidebar option in the view menu. The sidebar contains a search box and a list of layers available for display. These layers may be turned on or off as desired using check boxes. The main part of the Google Earth window is the map. The latitude, longitude, and altitude can be displayed in a status bar along the bottom edge of the map by placing a check next to the status bar option in the view menu. Three navigation controls (pan, rotate, and zoom) can be displayed along the right side of the map by selecting one of the options to show navigation in the view menu. To load a layer into Google Earth, click on File -> Open, browse to the location of your kmz or kml file, and click on the OK button. Your file will then appear in the sidebar along with a checkbox. Files containing more than one layer will have a small plus sign next to the filename. Clicking on the plus sign will expand the file into a list of folders (layers) available. In WBD.kmz, the folders may also be expanded to show a list of each of the individual watershed boundaries within the WBD lines layer, or the individual polygons within the WBD polygon layer.
User Tips:
- Because of the level of detail WBD.kmz provides, users may find it helpful to temporarily turn off its display (by un-checking the box next to WBD.kmz in the sidebar of the Google Earth window) until zoomed in to the area of interest.
- By clicking on the pushpin that labels each subwatershed (12-digit hydrologic unit), a text balloon is opened that provides additional information, such as its name, parent watershed, area, and the code of the subwatershed it drains into downstream.
- By opening the text balloons of the subwatersheds adjacent to your subwatershed of interest, you can determine if other areas drain into your subwatershed. The map can be used to determine what waterbodies may be within or immediately downstream of your subwatershed.
- Depending on the currentness of the imagery Google Earth displays for your area of interest, you may be able to determine the dominant type of landuse within a subwatershed. For example land uses like urban, cropland, or rangeland are often easily determined from the aerial images displayed by Google Earth.
- The color and thickness of the lines defining the boundary of each subwatershed indicate what level boundary each shared line segment is. For example, a bold pink line indicates a boundary between regions, a bold yellow line indicates a boundary between subregions, a bold blue line indicates a boundary between basins, and a bold green line indicates a boundary between subbasins. Thin red lines indicate boundaries between watersheds, and thin blue lines indicate boundaries between subwatersheds.
- To keep WBD.kmz available each time you open Google Earth, have it saved to your “My Places” folder when prompted as you exit Google Earth.
- If you find a location where the WBD lines appear to be incorrect and do not reflect actual drainage patterns, please notify South Dakota’s WBD Steward.
Increasingly, watershed improvement programs and water quality investigations (such as Total Maximum Daily Load [TMDL] studies) are being conducted based on hydrologic unit boundaries rather than on county or other political boundaries. Oftentimes, landowner eligibility for certain cost share funds associated within land management practices will be based on having land within a specific hydrologic unit. Making the WBD viewable in Google Earth will help landowners and others visualize and understand their locations in the perspective of the watersheds and subwatersheds around them. Improved knowledge and understanding of hydrologic units at the local level can help to bring about better stewardship by landowners and the general public.
Media
Sources/Usage: Some content may have restrictions. View Media Details
Media
Sources/Usage: Some content may have restrictions. View Media Details
Below are multimedia items associated with this project.
Watershed Boundary Data set
Project Period: 2009
Cooperator: Hyde County Conservation District, South Dakota Association of Conservation Districts
Project Chief: Ryan Thompson
Executive Summary
A drainage area is a specific area of land defined by topography, which drains to a specific point. A hydrologic unit is a specific drainage area that has been included in a “nested” system for numbering and cataloguing of streams and drainage areas. Different levels of hydrologic units can be defined with a nested structure to provide more detailed drainage maps. To describe which land areas are drained by a given drainage system, the United States has been mapped into 21 different hydrologic regions. Each of these regions has a two-digit numeric code assigned to it. Portions of three different hydrologic regions are found within South Dakota. Part of extreme northeastern South Dakota is in region 09, the Souris-Red-Rainy, which ultimately drains to the Hudson Bay. Another part of northeastern South Dakota is within region 07, the Upper Mississippi. By far the largest portion of South Dakota is in hydrologic region 10, the Missouri. Each region is further divided into subregions, which inherit the two-digit number code of their parent region, plus their own two digits. Additional levels of detail divide the subregions into basins, and two more digits are added to their codes. Basins have been further divided into subbasins and assigned two more digits, giving them an 8-digit code. Figure 1 shows the subbasins within and near South Dakota, and their 8-digit codes. Table 1 provides a description of these subbasins, and shows how each is nested within a basin, subregion, and region.
Recently, the Watershed Boundary Dataset, or WBD, was completed for the United States. The WBD further subdivided 8-digit subbasins into watersheds with 10-digit codes and subwatersheds with 12-digit codes. The final product of the WBD consists of electronic drainage area and boundary data layers for use in geographic information system (GIS) software. More information on the WBD in South Dakota can be found on the project page for the South Dakota WBD. Because of the scale and level of detail inherent in the WBD, publishing a paper map product was not practical. Although the GIS format of the WBD makes it well-suited to mapping and spatial analysis, it is not necessarily readily accessible to individuals without access to GIS software. Landowners, individuals responsible for or interested in the implementation of conservation and watershed management programs, individuals within educational institutions, and the general public may not be able to use the WBD in its native format to learn more about their watershed and ecosystem. In order to make the WBD available to a wider audience, the U.S. Geological Survey has developed this internet resource page in cooperation with the Hyde County Conservation District and the South Dakota Association of Conservation Districts.
In recent years, public domain software such as Google Earth has made it possible for anyone with internet access to view maps and high-resolution imagery of the earth’s surface. Converting the WBD GIS data layers to a Keyhole Markup Language (kml) file makes them available as data layers that may be displayed in Google Earth. Users need only download a free copy of Google Earth software to a home computer or access a computer at a public library or other location that already has Google Earth installed. A kmz file (zipped kml file) of the WBD downloaded from this site may then be opened in Google Earth.
For those unfamiliar with Google Earth, a brief orientation may be helpful. A menu bar is located along the top of the Google Earth window. An area called the sidebar can be displayed on the left side of the window by placing a check next to the sidebar option in the view menu. The sidebar contains a search box and a list of layers available for display. These layers may be turned on or off as desired using check boxes. The main part of the Google Earth window is the map. The latitude, longitude, and altitude can be displayed in a status bar along the bottom edge of the map by placing a check next to the status bar option in the view menu. Three navigation controls (pan, rotate, and zoom) can be displayed along the right side of the map by selecting one of the options to show navigation in the view menu. To load a layer into Google Earth, click on File -> Open, browse to the location of your kmz or kml file, and click on the OK button. Your file will then appear in the sidebar along with a checkbox. Files containing more than one layer will have a small plus sign next to the filename. Clicking on the plus sign will expand the file into a list of folders (layers) available. In WBD.kmz, the folders may also be expanded to show a list of each of the individual watershed boundaries within the WBD lines layer, or the individual polygons within the WBD polygon layer.
User Tips:
- Because of the level of detail WBD.kmz provides, users may find it helpful to temporarily turn off its display (by un-checking the box next to WBD.kmz in the sidebar of the Google Earth window) until zoomed in to the area of interest.
- By clicking on the pushpin that labels each subwatershed (12-digit hydrologic unit), a text balloon is opened that provides additional information, such as its name, parent watershed, area, and the code of the subwatershed it drains into downstream.
- By opening the text balloons of the subwatersheds adjacent to your subwatershed of interest, you can determine if other areas drain into your subwatershed. The map can be used to determine what waterbodies may be within or immediately downstream of your subwatershed.
- Depending on the currentness of the imagery Google Earth displays for your area of interest, you may be able to determine the dominant type of landuse within a subwatershed. For example land uses like urban, cropland, or rangeland are often easily determined from the aerial images displayed by Google Earth.
- The color and thickness of the lines defining the boundary of each subwatershed indicate what level boundary each shared line segment is. For example, a bold pink line indicates a boundary between regions, a bold yellow line indicates a boundary between subregions, a bold blue line indicates a boundary between basins, and a bold green line indicates a boundary between subbasins. Thin red lines indicate boundaries between watersheds, and thin blue lines indicate boundaries between subwatersheds.
- To keep WBD.kmz available each time you open Google Earth, have it saved to your “My Places” folder when prompted as you exit Google Earth.
- If you find a location where the WBD lines appear to be incorrect and do not reflect actual drainage patterns, please notify South Dakota’s WBD Steward.
Increasingly, watershed improvement programs and water quality investigations (such as Total Maximum Daily Load [TMDL] studies) are being conducted based on hydrologic unit boundaries rather than on county or other political boundaries. Oftentimes, landowner eligibility for certain cost share funds associated within land management practices will be based on having land within a specific hydrologic unit. Making the WBD viewable in Google Earth will help landowners and others visualize and understand their locations in the perspective of the watersheds and subwatersheds around them. Improved knowledge and understanding of hydrologic units at the local level can help to bring about better stewardship by landowners and the general public.
Media
Sources/Usage: Some content may have restrictions. View Media Details
Media
Sources/Usage: Some content may have restrictions. View Media Details
Below are multimedia items associated with this project.
Watershed Boundary Data set
Watershed Boundry Dataset