



FORT Science in Action 2026, Part 9: Supporting greater sage-grouse monitoring for state and federal agencies across the West
USGS researchers are improving the understanding of greater sage-grouse population declines across the American West. This year, long-term monitoring coupled with directed studies revealed that habitat fragmentation and drought contribute to sage-grouse declines. In addition, researchers published updates to a widely used monitoring tool that assists managers in prioritizing conservation efforts.
All sagebrush, all the time
Sage-grouse are sagebrush specialists. Part of an exclusive club of creatures — including mule deer, pronghorn, and pygmy rabbits — these grouse can tolerate toxic terpene chemicals, allowing them to forage on sagebrush.
Thanks to intricately patterned plumage, you likely won’t see sage-grouse outside of the spring season, when the males display on open habitats within the sagebrush that are communal breeding grounds called leks. Puffing their chests, fanning their spiky tail feathers, and inflating their olive-green air sacks on their chests to make popping and swishing sounds, males strut their stuff for the hens.
Their dependence on this expansive sagebrush habitat through their annual life cycle means they are an excellent indicator species: monitoring sage-grouse populations provides insights on the health of the entire sagebrush ecosystem.
Tracking and understanding population dynamics
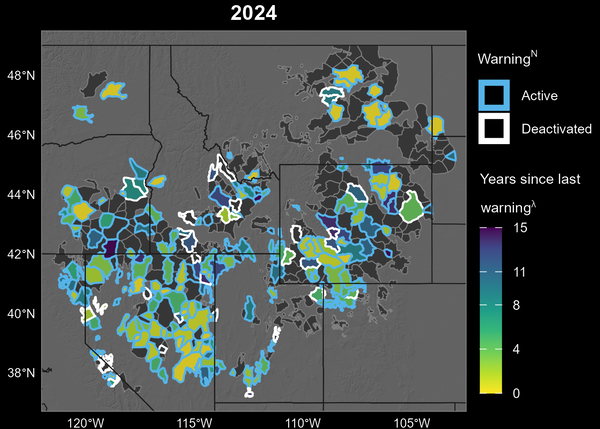
For decades, federal and state wildlife agencies have monitored sage-grouse populations across the American West. Understanding population declines helps inform management decisions regarding land use, hunting, and conservation. Over the past 55 years, populations have declined by almost 80%. Recent additions to this long-term study, published December of last year, updated a warning tool that flags populations experiencing both local perturbations that cause decoupling and decline in trends, but also identifies chronic warnings when lower than expected abundance puts populations at increased risk of disappearing. This study documented that, on average, these fragile populations take over 8 years to rebound, so preventing declines is key. But how do we determine the causes?
Habitat fragmentation, by events such as human development and wildfire, can lead to sage-grouse population declines. A study published by USGS researchers this summer revealed that in Oregon, larger, less fragmented habitats supported more grouse. After declines, these robust populations rebounded faster than small populations in isolated areas. Late last year, scientists from USGS and the Nevada Department of Wildlife also discovered that precipitation can boost sage-grouse populations, while drought caused declines. These results are also in line with attenuated associations observed between sage-grouse population trends and livestock indices under more mesic conditions. Overall, USGS research informs efforts to anticipate declines and prioritize populations in need of conservation action, as well as support large-scale sagebrush conservation initiatives.
More FORT Science in Action
This September, FORT is highlighting how our science projects support sound decision-making. Each day, we will highlight a new project and its applications. To see more, follow the tabs below.
Related
Shrubland, Alpine and Grassland Ecology (SAGE) Wildlife Research Group

Greater Sage-Grouse Population Monitoring Framework
Related
Shrubland, Alpine and Grassland Ecology (SAGE) Wildlife Research Group