‘Extreme Drought’ Hits Northern New England States
USGS streamflow and water-level information informs drought managers as conditions worsen and 86% of northern New England states are categorized as being in a drought, according to the U.S. Drought Monitor.
Over the last several weeks, drought conditions have intensified in the Northeast. USGS is continuing to monitor extreme low flows and have been taking additional field measurements at streamgage sites to confirm the accuracy of the real-time streamflow data. Since August 1, USGS hydrologic technicians have made 341 field measurements of discharge at 186 locations in Maine, New Hampshire, and Vermont, according to Richard Kiah.
Data from the USGS real-time streamflow and groundwater monitoring stations are used by Federal and State agencies to categorize the severity of the drought so natural resource managers can make decisions based on the most up-to-date information.
The National Integrated Drought Information System (NIDIS), a program within NOAA that provides drought information to the public, uses the streamflow and groundwater data from USGS and other partners to create the U.S. Drought Monitor.
As of September 18, according to the U.S. Drought Monitor, drought conditions are occurring within:
- 94% of New Hampshire, 50% of which is in “severe drought” and nearly 23% of which is in “extreme drought”
- 63% of Maine, 52% of which is in “severe drought” and almost 6% of which is in “extreme drought”
- 100% of Vermont, 78% of which is in “severe drought” and 2% of which is in “extreme drought”
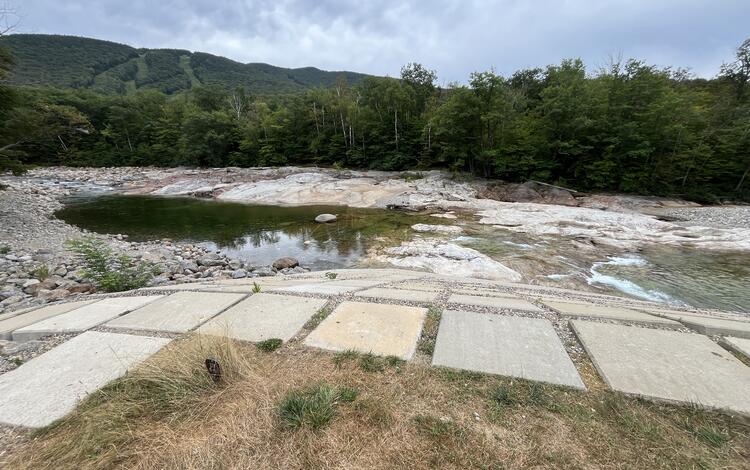
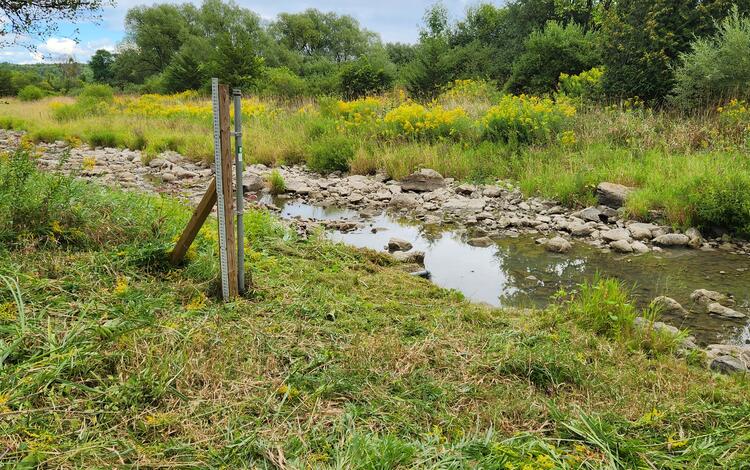
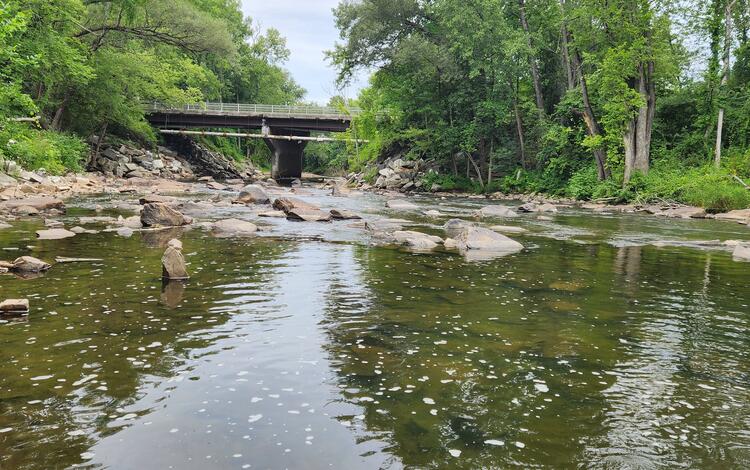
In addition to noticeably lower low flows in rivers and streams that negatively impact water recreation and conditions for fish and plants, extreme drought conditions can cause crop loss, declining water tables, and limitations on water use.
Southern New England is faring better, with drought conditions existing in 16% of Massachusetts and 13% of Rhode Island.
***
One way to evaluate streamflow conditions is the 7-day average streamflow, which is the average streamflow observed for the seven days prior to that date. Averaging the last 7 days of streamflow provides a better understanding of longer-term conditions. Having long-term streamflow data allows us to define the 7-day average streamflow in terms of a percentile class, a value on a scale of 100 that indicates the percentage of time the streamflow is equal to or below it. In August and September, Vermont, New Hampshire, and Maine have been close to or below the lowest 5th percentile class regarding low flows, which means that the streamflows recorded are lower than 95% of historical flows.
As of September 14:
- VERMONT
- A streamgage on Otter Creek at Center Rutland, Vermont, recorded the lowest 7-day average streamflow over its period of record of 97 years.
- MAINE
- A streamgage on Androscoggin River near Auburn, Maine, recorded the second lowest 7-day average streamflow over its period of record of 96 years.
- A streamgage on Cobbosseecontee Stream at Gardiner, Maine, recorded the recorded the third lowest 7-day average streamflow over its period of record of 123 years.
- NEW HAMPSHIRE
- a streamgage on Sugar River at West Claremont, New Hampshire, recorded the third lowest 7-day average streamflow over its period of record of 97 years.