
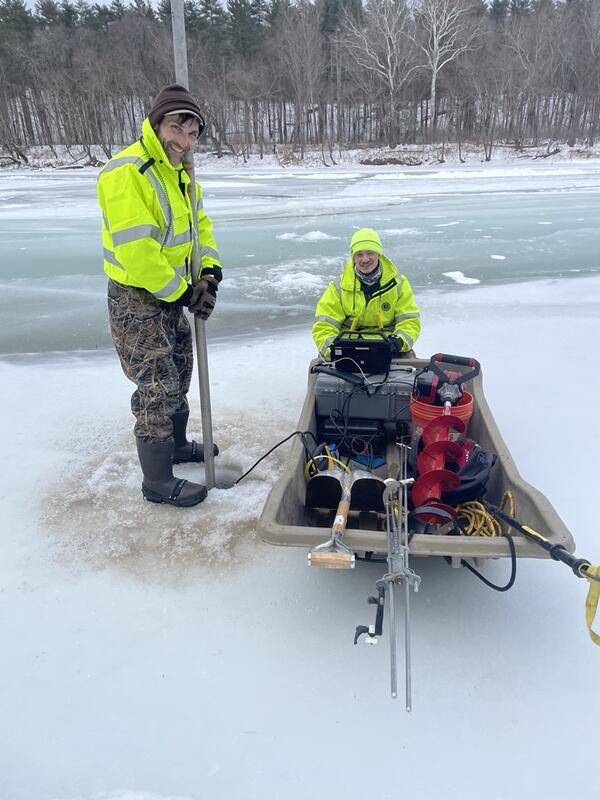
USGS Scientist Jon Suchy collects and records data on a laptop while scientist Pat Bowen measures the thickness of the ice during their measurement of the flow under the ice at USGS 01438500 Delaware River at Montague, New Jersey
Delaware River at Montague Ice Affected Discharge Measurement
Completed
By New Jersey Water Science Center
March 26, 2026
On February 11, 2026, a team of scientists from the New Jersey Water Science Center made a discharge measurement at the USGS 01438500 Delaware River at Montague, New Jersey monitoring site during ice cover conditions. This is the first time since February 1999 that this type of measurement was made at this site. Frigid winter weather conditions made the measurement both necessary and possible.
01438500 Delaware River at Montague Water Data
01438500 Delaware River at Montague Water Data
Current conditions for 0138500 Delaware River at Montague, New Jersey Monitoring Site
01438500 Delaware River at Montague Webcam
01438500 Delaware River at Montague Webcam
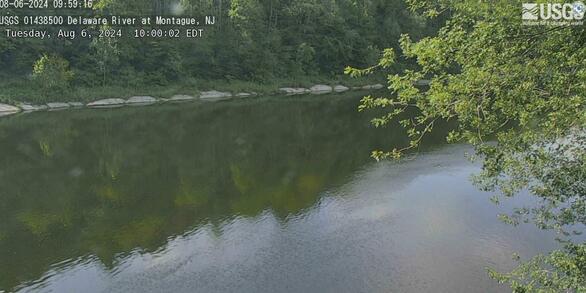
HIVIS Camera feed from Delaware River at Montague, New Jersey
How does Ice on Rivers and Streams Affect USGS Streamflow Data
How does Ice on Rivers and Streams Affect USGS Streamflow Data
During colder winter periods ice can form in rivers and streams altering the natural relationship between stage and discharge (flow).
Making a Plan
Making a Plan
Measuring the flow under ice is an exploration in logistics. First, the ice needs to be thick enough to safely support the work being done. This does not happen very often in New Jersey, but the arctic surge of January 2026 provided us with optimal conditions in northern New Jersey.
Once it has been determined that ice conditions are likely thick enough for a measurement to be made, a safety plan is put in place because the safety of our scientists is of highest priority. The Local authorities are brought in on the plan for their awareness.
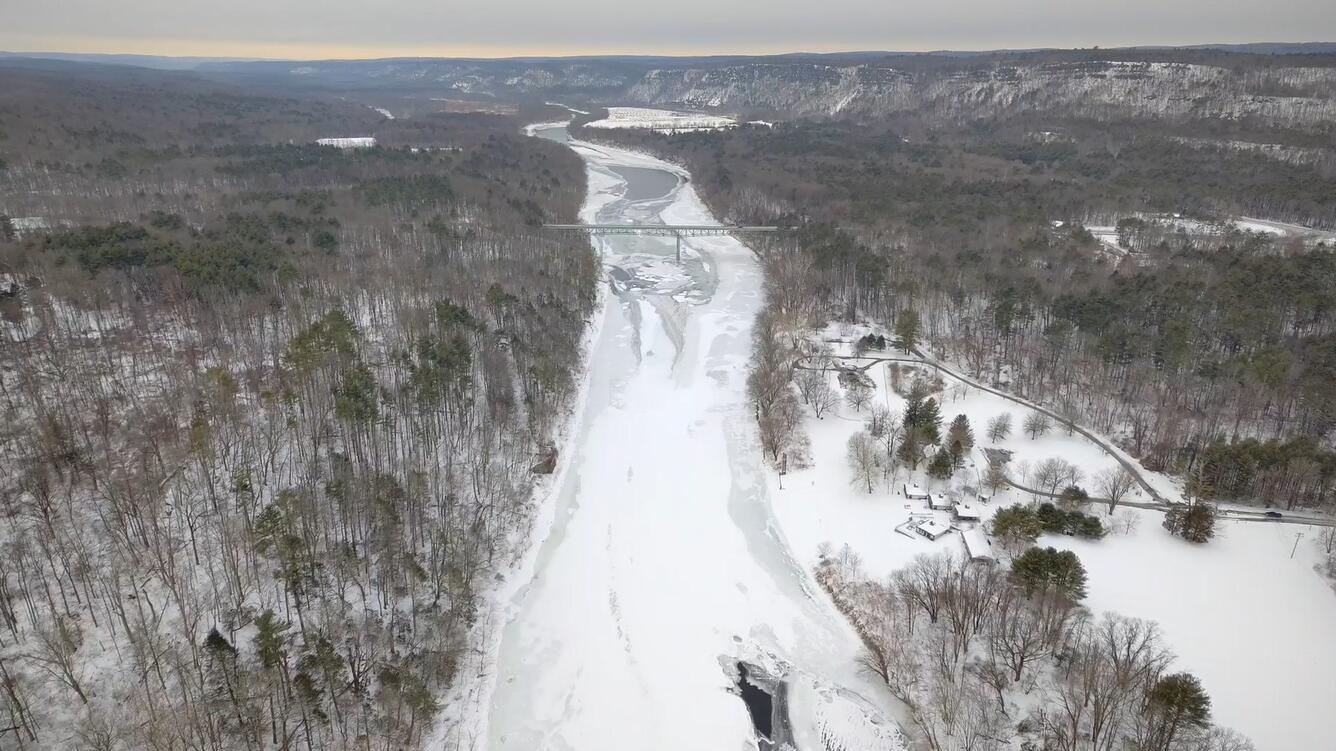
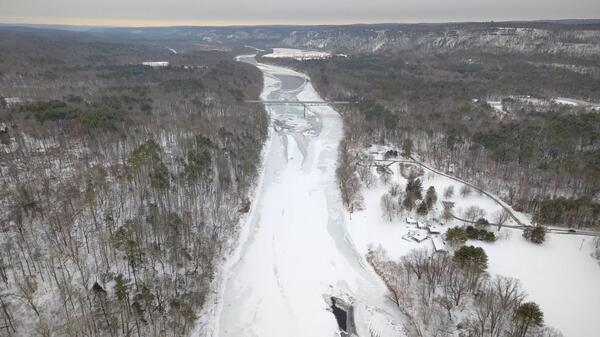
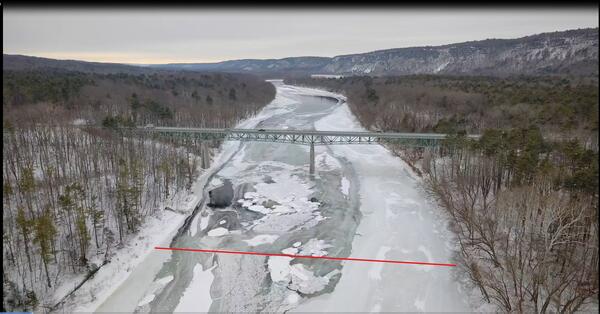
Once on site, the location of a cross section for the measurement needs to be determined. An Unmanned Aerial System (UAS) drone is used to survey the local river reach to help identify a potential safe cross section.
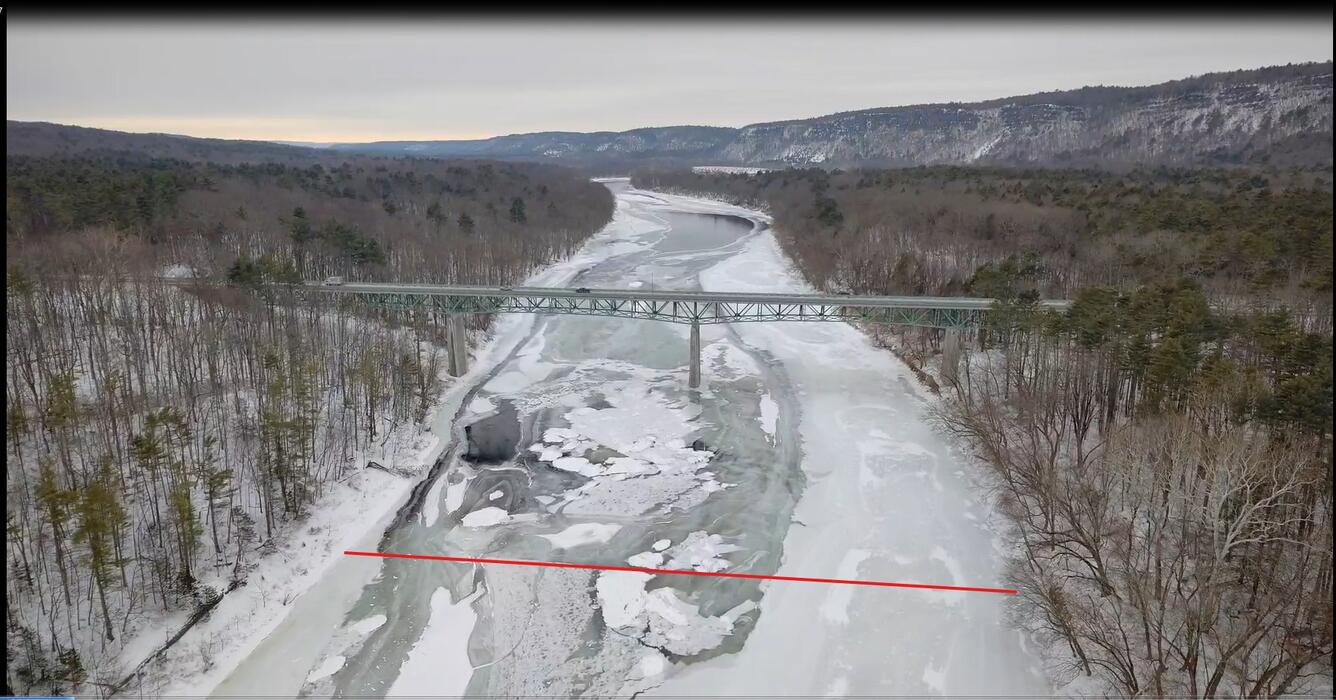
Next, boots hit the ground for exploration. The ice cover is tested for stability and to determine uniform conditions. Finally, the measurement cross section is selected. (demarcated on the aerial photograph below).
Media

Sources/Usage: Public Domain. View Media Details
Sources/Usage: Public Domain. View Media Details
Setting up the Measurement
Setting up the Measurement
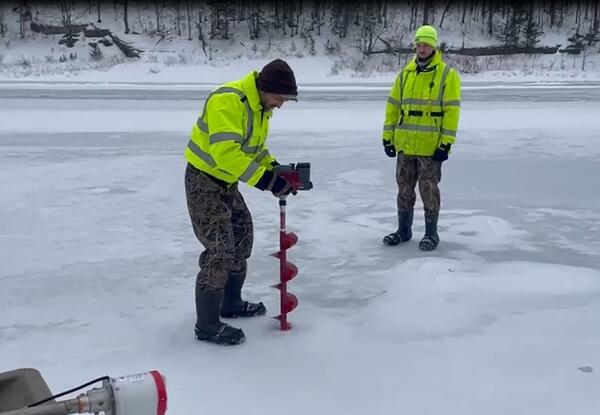
Once the cross section has been selected, USGS scientists navigate onto the ice. A test borehole is drilled, and a wading rod is used to measure the thickness of the ice and verify the safety of the cross section.
After testing the ice thickness, the scientists then proceed to move across the river drilling a series of holes along the way to create a line of typically 15 to 20 holes from near edge to far edge.
Sources/Usage: Public Domain. View Media Details

Measuring the Flow
Measuring the Flow
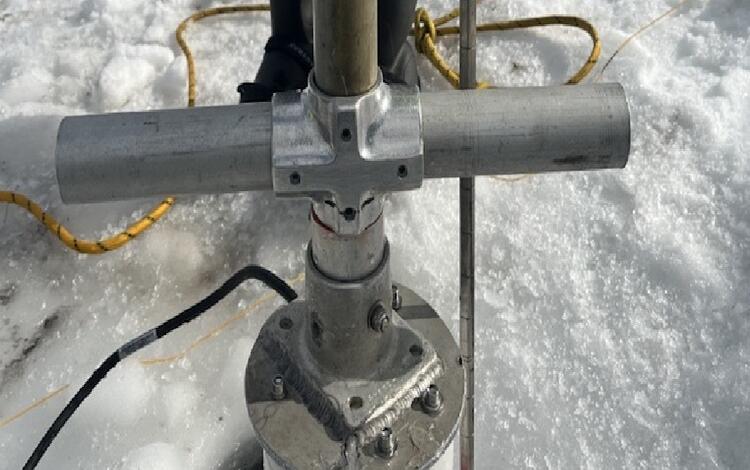
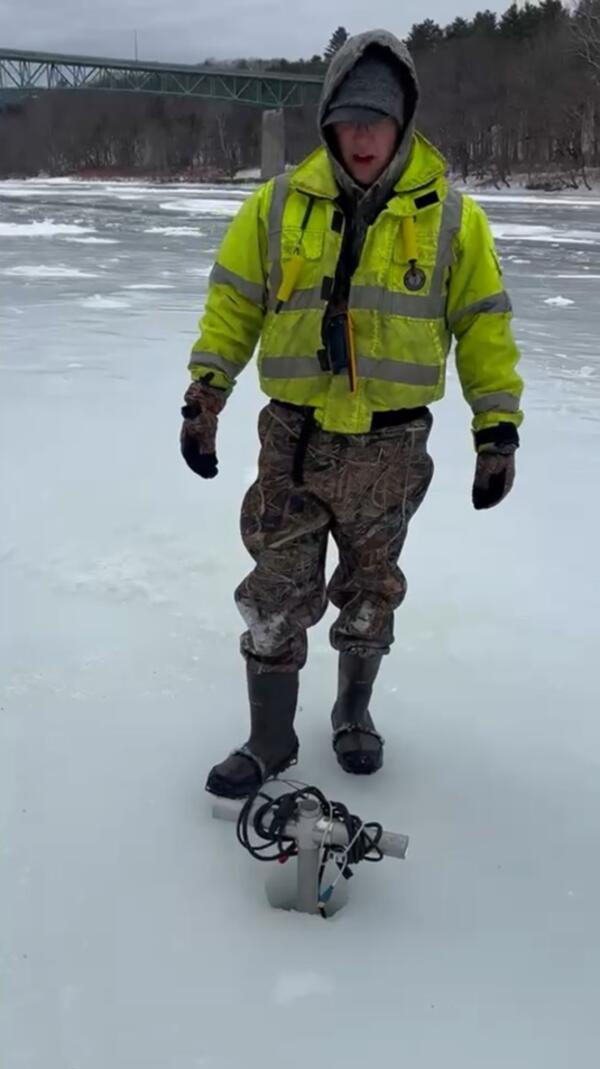
Holes are drilled in a straight line across the river roughly along the cross section planned in the previous step. Under ideal conditions, the ice in a cross section should be relatively uniform (the thickness of the ice for this measurement was a consistent 1.2 feet). We also need to account for the thickness of potential slush beneath the ice. Graduation marks on the Acoustic Doppler Current Profiler (ADCP) mount are used to measure the combined ice and slush thickness.
An ADCP, which uses soundwaves to record the movement of particles suspended in the water, is attached to the mount. This unit will be lowered below the ice and slush layers to read the depth and velocity of the flowing waters below.
Sources/Usage: Public Domain. View Media Details
Coming Home
Coming Home
Our team of USGS scientists, having completed the long job of collecting the data gather their equipment once more for the trek back to the safety of the shore. There, they will review the collected data to ensure they have collected what they need and pack up for a job well done.
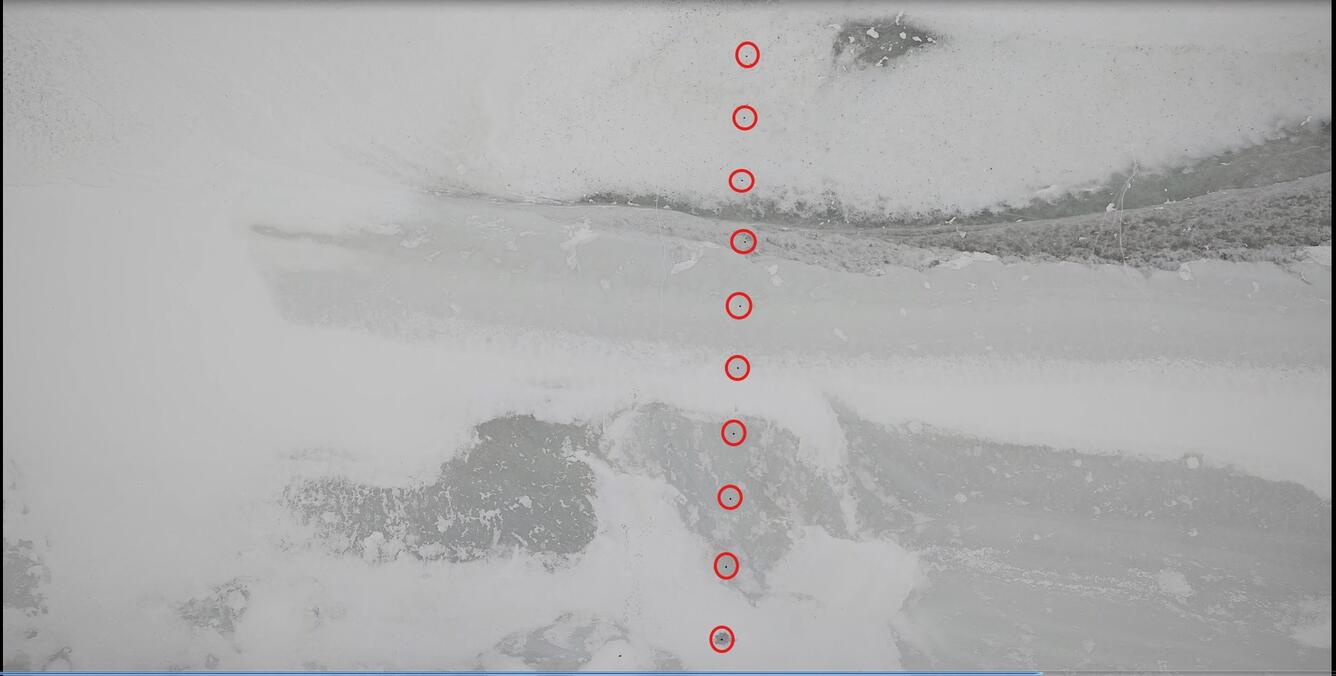
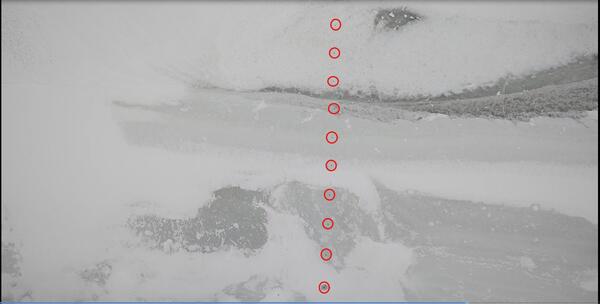
One more UAS Drone pass with a thermal camera is made to look at the site, seeing things in ways we normally don’t see.
Sources/Usage: Public Domain. View Media Details
The Final Product
The Final Product
Having collected the data and returned to the warmth of the office, the USGS scientists post process and review the information they collected.
Media
Sources/Usage: Public Domain. View Media Details
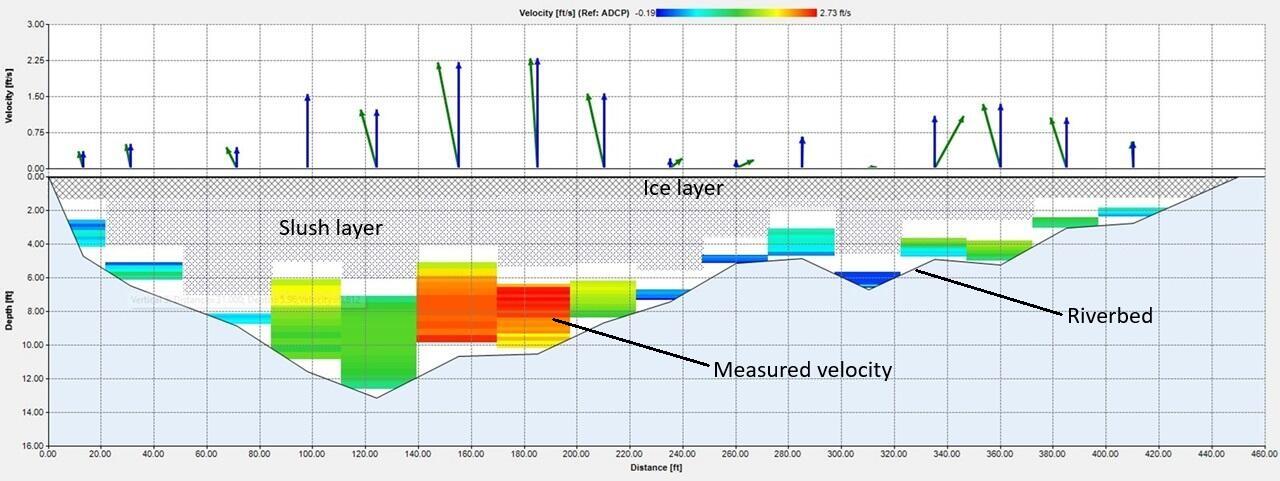
The top graph shows the velocity direction and magnitude of flow, giving the scientists a quick overview of the flow conditions in each subsection. The lower graph shows the cross-sectional shape of the riverbed with the colored blocks indicating the velocity in each subsection.
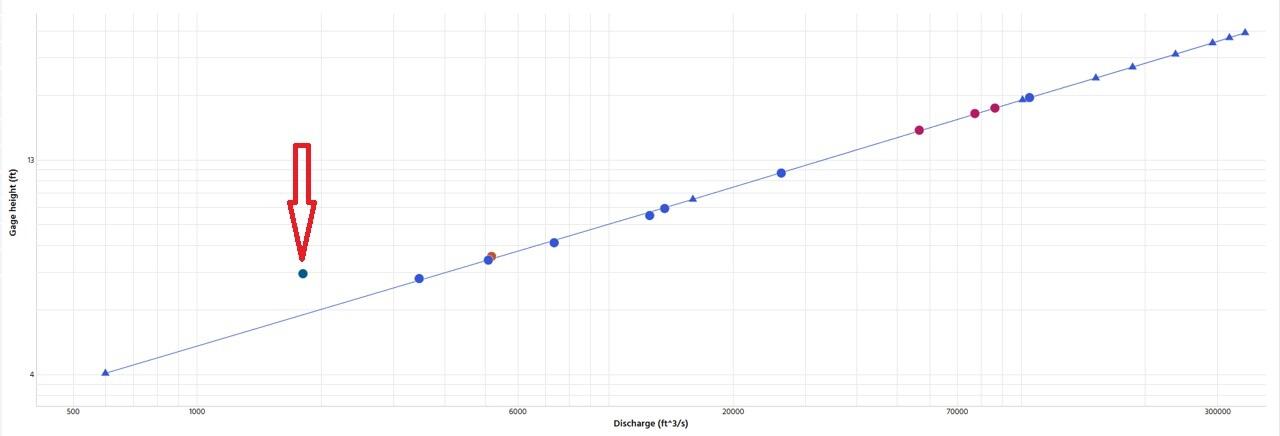
An ice affected measurement is not typically used for stage-discharge rating curve development but plotted below shows the amount of backwater created by the ice in the river. The other measurements shown on the graph below are measurements made with clear channel conditions. The ice and slush in the river results in over 1 foot of shift (or backwater) to the normal stage-discharge rating.
Media
Sources/Usage: Public Domain. View Media Details
This was a good opportunity for our scientists to learn and hone their skills.
Sources/Usage: Public Domain. View Media Details
Montague Ice Sampling
USGS Scientist Jon Suchy collects and records data on a laptop while scientist Pat Bowen measures the thickness of the ice during their measurement of the flow under the ice at USGS 01438500 Delaware River at Montague, New Jersey
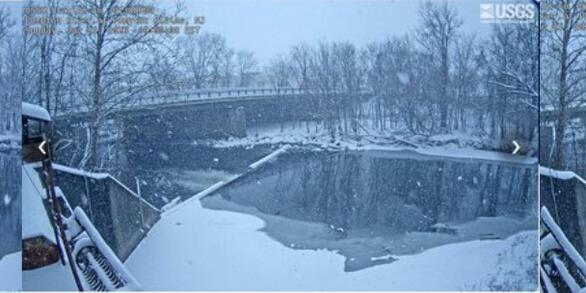
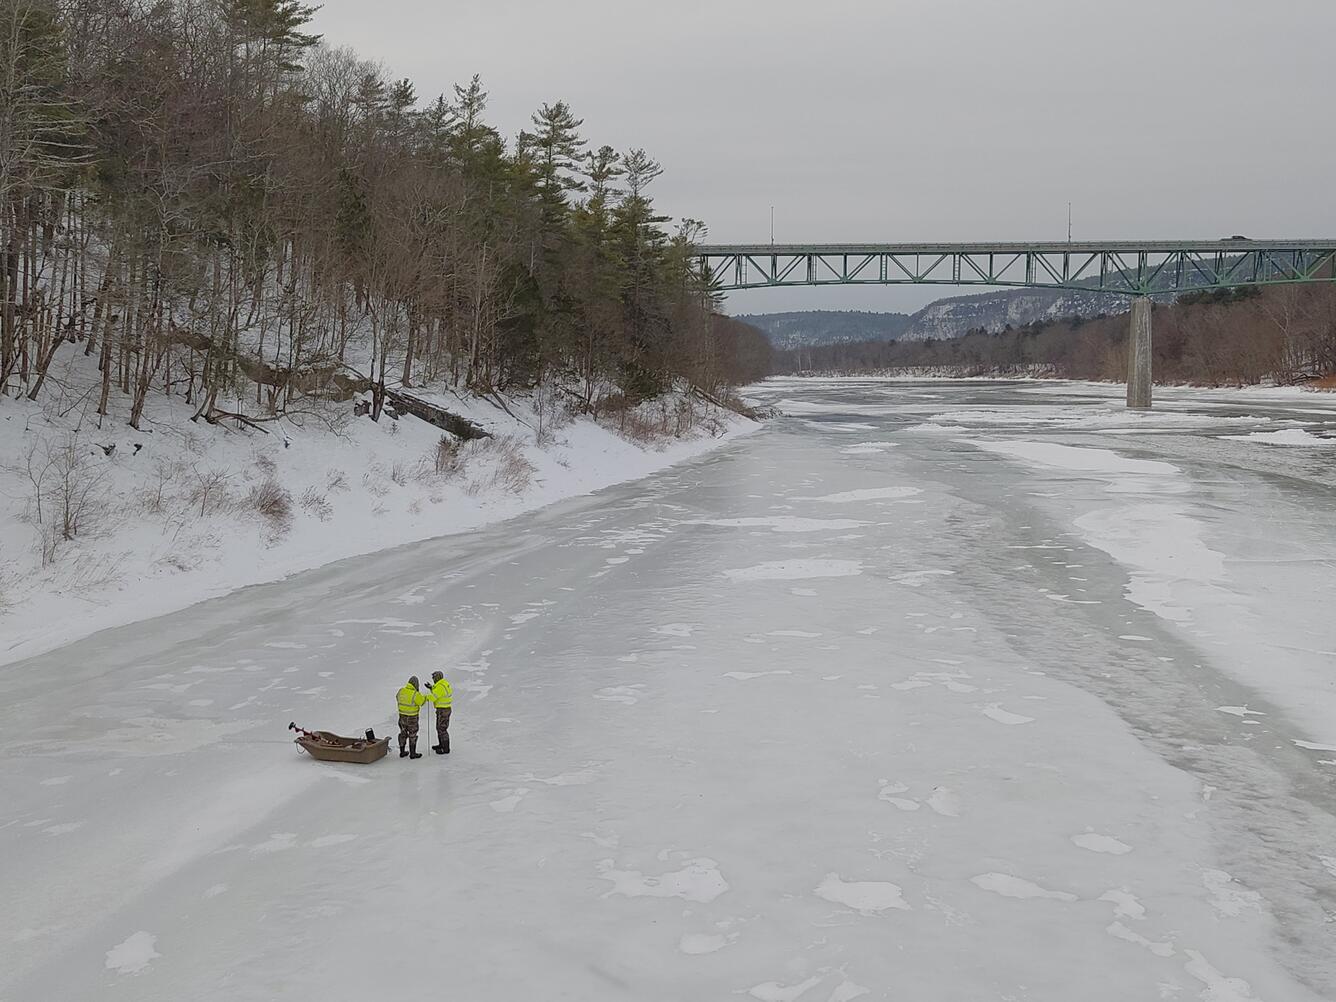
A frozen view of the Delaware
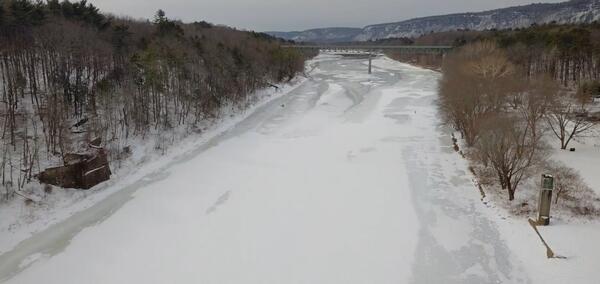
Looking out over the frozen Delaware River at the Montague Gage house on the right and the bridge in the distance downstream at the USGS 01438500 Delaware River at Montague site before the ice measurement is made
Looking out over the frozen Delaware River at the Montague Gage house on the right and the bridge in the distance downstream at the USGS 01438500 Delaware River at Montague site before the ice measurement is made
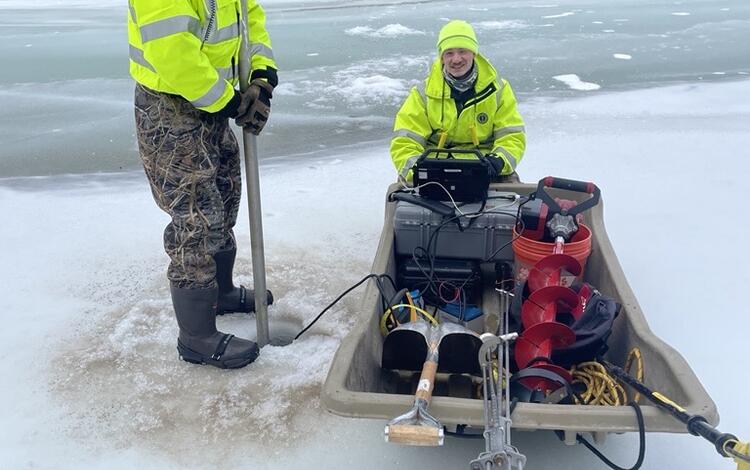
Montague Ice Measurement
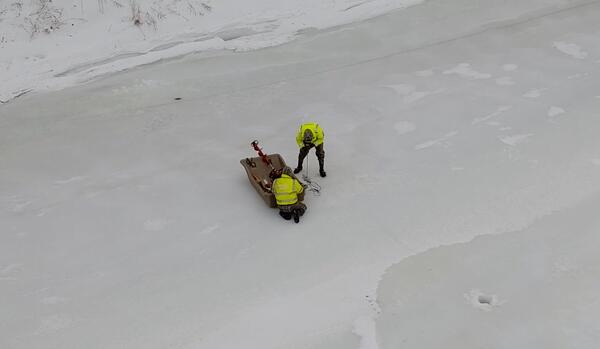
USGS Scientists Jon Suchy and Pat Bowen working off of an ice sled, lower an acoustic sensor below the ice, through the hole they drilled to obtain flow information for the USGS 01438500 Delaware River at Montague, New Jersey site
USGS Scientists Jon Suchy and Pat Bowen working off of an ice sled, lower an acoustic sensor below the ice, through the hole they drilled to obtain flow information for the USGS 01438500 Delaware River at Montague, New Jersey site
IR view of the ice work
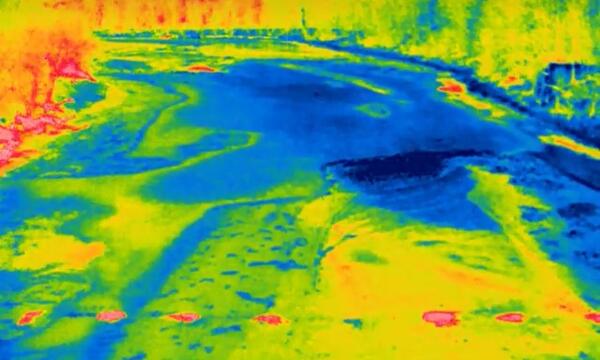
Looking at the USGS 01483500 Delaware River at Montague, New Jersey through an Infra-red camera which shows the differences in the ice as shades of color. The red circles along the bottom are the boreholes where the warmer water below is exposed to the surface.
Looking at the USGS 01483500 Delaware River at Montague, New Jersey through an Infra-red camera which shows the differences in the ice as shades of color. The red circles along the bottom are the boreholes where the warmer water below is exposed to the surface.
Montague Ice Probe
USGS Scientist Karl Braun lowers an Acoustic Probe below the ice to collect the flow data for the USGS 01438500 Delaware River at Montague, New Jersey site
USGS Scientist Karl Braun lowers an Acoustic Probe below the ice to collect the flow data for the USGS 01438500 Delaware River at Montague, New Jersey site
Montague Ice Drilling
USGS Scientists Patric Bowen and Jon Suchy drill a Borehole in the ice on the Delaware river at USGS 01438500 Delaware River at Montague, New Jersey
USGS Scientists Patric Bowen and Jon Suchy drill a Borehole in the ice on the Delaware river at USGS 01438500 Delaware River at Montague, New Jersey
Delaware Ice Measurement wide
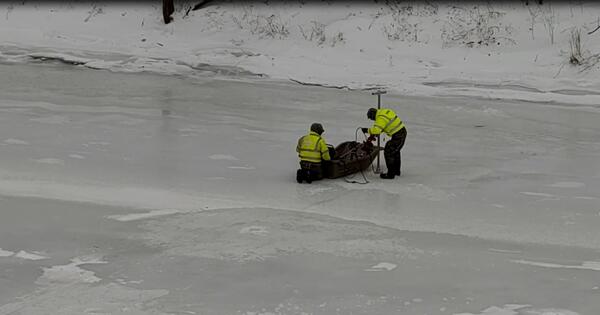
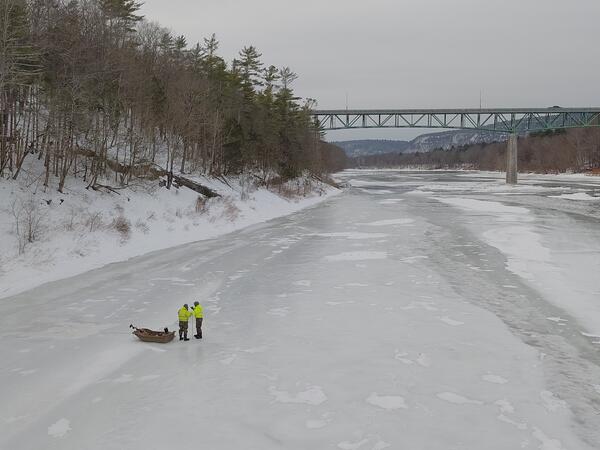
Two USGS Scientists standing on the frozen Delaware River preparing to make an ice measurement at the USGS 01438500 Delaware River at Montague, New Jersey site.
Two USGS Scientists standing on the frozen Delaware River preparing to make an ice measurement at the USGS 01438500 Delaware River at Montague, New Jersey site.
Montague Bridge Ice
Looking downstream along the frozen river at the Montague bridge and the USGS 01438500 Delaware River at Montague, New Jersey site
Looking downstream along the frozen river at the Montague bridge and the USGS 01438500 Delaware River at Montague, New Jersey site
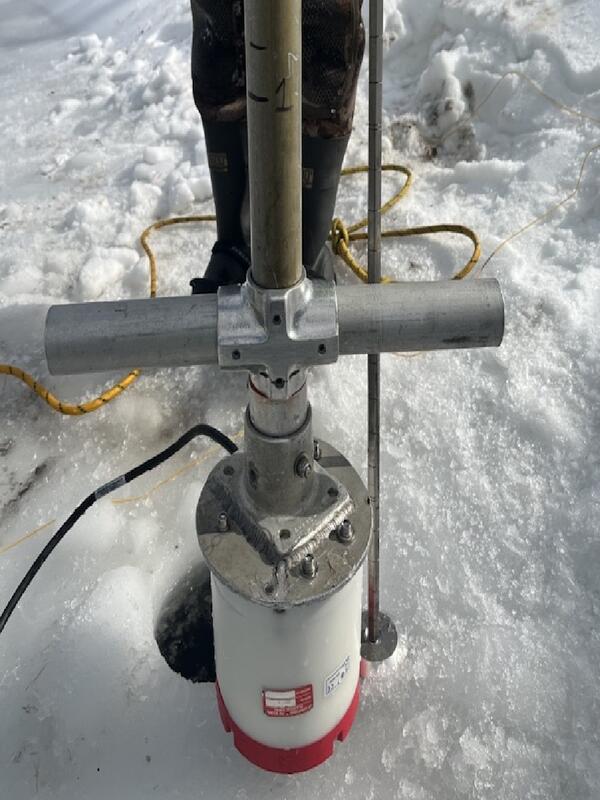
Delaware Ice Measurement Sensor
Looking at the Acoustic Dopler Current Profiler (ADCP) being used to measure the flow below the ice next to a traditional wading rod inn front of the borehole in in the ice at USGS 01438500 Delaware River at Montague, New Jersey
Looking at the Acoustic Dopler Current Profiler (ADCP) being used to measure the flow below the ice next to a traditional wading rod inn front of the borehole in in the ice at USGS 01438500 Delaware River at Montague, New Jersey
Delaware Ice Measurement Sampling
USGS scientists Patrick Bowen and Jon Suchy collecting flow data through a borehole in the ice at USGS 01438500 Delaware River at Montague, New Jersey
USGS scientists Patrick Bowen and Jon Suchy collecting flow data through a borehole in the ice at USGS 01438500 Delaware River at Montague, New Jersey

Beginning Ice Measurement
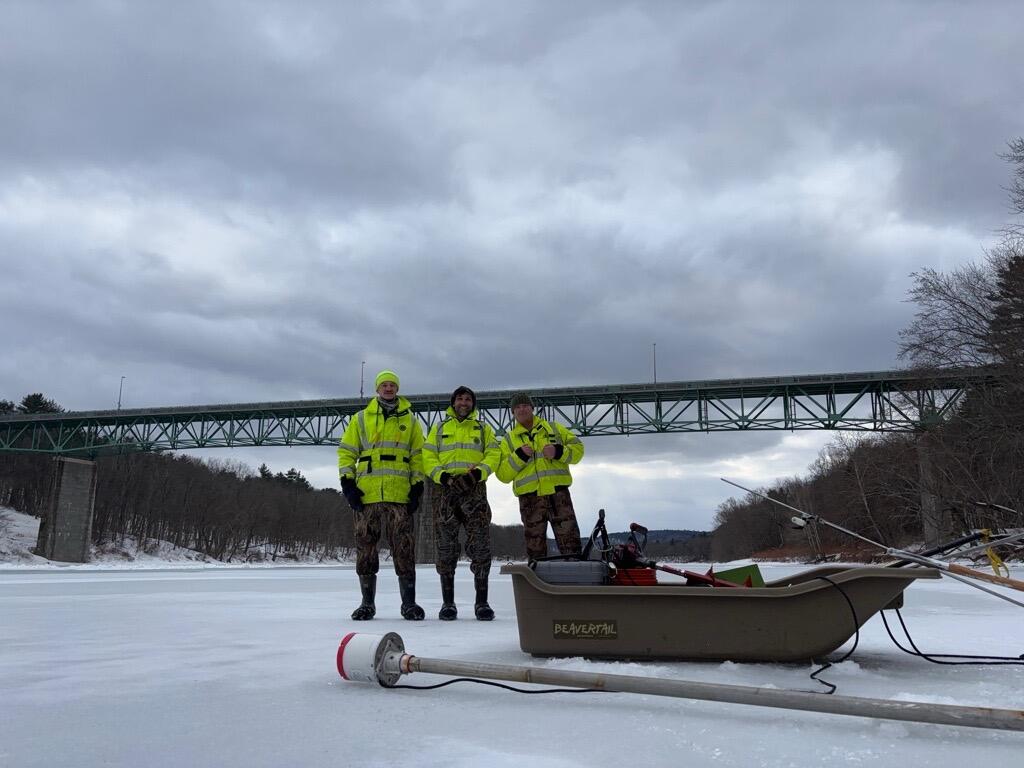
USGS Scientists Jon Suchy, Pat Bowen, and Jason Shvanda Standing on the frozen Delaware River at the USGS 01438500 Delaware River at Montague, New Jersey site with their ice measurement equipment as they prepare to make their measurement
USGS Scientists Jon Suchy, Pat Bowen, and Jason Shvanda Standing on the frozen Delaware River at the USGS 01438500 Delaware River at Montague, New Jersey site with their ice measurement equipment as they prepare to make their measurement
Delaware River Ice Cross-Section
Aerial view looking downstream at USGS site 01438500 Delaware River at Montague, New Jersey and seeing the bridge over the frozen river with a red highlighted line indicating the intended cross section for the ice measurement.
Aerial view looking downstream at USGS site 01438500 Delaware River at Montague, New Jersey and seeing the bridge over the frozen river with a red highlighted line indicating the intended cross section for the ice measurement.
Delaware Ice Boreholes
Aerial view of the Boreholes drilled in the ice to measure the flow at the USGS site 01438500 Delaware River at Montague, New Jersey
Aerial view of the Boreholes drilled in the ice to measure the flow at the USGS site 01438500 Delaware River at Montague, New Jersey
On February 11, 2026, a team of scientists from the New Jersey Water Science Center made a discharge measurement at the USGS 01438500 Delaware River at Montague, New Jersey monitoring site during ice cover conditions. This is the first time since February 1999 that this type of measurement was made at this site. Frigid winter weather conditions made the measurement both necessary and possible.
01438500 Delaware River at Montague Water Data
01438500 Delaware River at Montague Water Data
Current conditions for 0138500 Delaware River at Montague, New Jersey Monitoring Site
01438500 Delaware River at Montague Webcam
01438500 Delaware River at Montague Webcam
HIVIS Camera feed from Delaware River at Montague, New Jersey
How does Ice on Rivers and Streams Affect USGS Streamflow Data
How does Ice on Rivers and Streams Affect USGS Streamflow Data
During colder winter periods ice can form in rivers and streams altering the natural relationship between stage and discharge (flow).
Making a Plan
Making a Plan
Measuring the flow under ice is an exploration in logistics. First, the ice needs to be thick enough to safely support the work being done. This does not happen very often in New Jersey, but the arctic surge of January 2026 provided us with optimal conditions in northern New Jersey.
Once it has been determined that ice conditions are likely thick enough for a measurement to be made, a safety plan is put in place because the safety of our scientists is of highest priority. The Local authorities are brought in on the plan for their awareness.
Once on site, the location of a cross section for the measurement needs to be determined. An Unmanned Aerial System (UAS) drone is used to survey the local river reach to help identify a potential safe cross section.
Next, boots hit the ground for exploration. The ice cover is tested for stability and to determine uniform conditions. Finally, the measurement cross section is selected. (demarcated on the aerial photograph below).
Media
Sources/Usage: Public Domain. View Media Details
Sources/Usage: Public Domain. View Media Details
Setting up the Measurement
Setting up the Measurement
Once the cross section has been selected, USGS scientists navigate onto the ice. A test borehole is drilled, and a wading rod is used to measure the thickness of the ice and verify the safety of the cross section.
After testing the ice thickness, the scientists then proceed to move across the river drilling a series of holes along the way to create a line of typically 15 to 20 holes from near edge to far edge.
Sources/Usage: Public Domain. View Media Details
Measuring the Flow
Measuring the Flow
Holes are drilled in a straight line across the river roughly along the cross section planned in the previous step. Under ideal conditions, the ice in a cross section should be relatively uniform (the thickness of the ice for this measurement was a consistent 1.2 feet). We also need to account for the thickness of potential slush beneath the ice. Graduation marks on the Acoustic Doppler Current Profiler (ADCP) mount are used to measure the combined ice and slush thickness.
An ADCP, which uses soundwaves to record the movement of particles suspended in the water, is attached to the mount. This unit will be lowered below the ice and slush layers to read the depth and velocity of the flowing waters below.
Sources/Usage: Public Domain. View Media Details
Coming Home
Coming Home
Our team of USGS scientists, having completed the long job of collecting the data gather their equipment once more for the trek back to the safety of the shore. There, they will review the collected data to ensure they have collected what they need and pack up for a job well done.
One more UAS Drone pass with a thermal camera is made to look at the site, seeing things in ways we normally don’t see.
Sources/Usage: Public Domain. View Media Details
The Final Product
The Final Product
Having collected the data and returned to the warmth of the office, the USGS scientists post process and review the information they collected.
Media
Sources/Usage: Public Domain. View Media Details
The top graph shows the velocity direction and magnitude of flow, giving the scientists a quick overview of the flow conditions in each subsection. The lower graph shows the cross-sectional shape of the riverbed with the colored blocks indicating the velocity in each subsection.
An ice affected measurement is not typically used for stage-discharge rating curve development but plotted below shows the amount of backwater created by the ice in the river. The other measurements shown on the graph below are measurements made with clear channel conditions. The ice and slush in the river results in over 1 foot of shift (or backwater) to the normal stage-discharge rating.
Media
Sources/Usage: Public Domain. View Media Details
This was a good opportunity for our scientists to learn and hone their skills.
Sources/Usage: Public Domain. View Media Details
Montague Ice Sampling
USGS Scientist Jon Suchy collects and records data on a laptop while scientist Pat Bowen measures the thickness of the ice during their measurement of the flow under the ice at USGS 01438500 Delaware River at Montague, New Jersey
USGS Scientist Jon Suchy collects and records data on a laptop while scientist Pat Bowen measures the thickness of the ice during their measurement of the flow under the ice at USGS 01438500 Delaware River at Montague, New Jersey
A frozen view of the Delaware
Looking out over the frozen Delaware River at the Montague Gage house on the right and the bridge in the distance downstream at the USGS 01438500 Delaware River at Montague site before the ice measurement is made
Looking out over the frozen Delaware River at the Montague Gage house on the right and the bridge in the distance downstream at the USGS 01438500 Delaware River at Montague site before the ice measurement is made
Montague Ice Measurement
USGS Scientists Jon Suchy and Pat Bowen working off of an ice sled, lower an acoustic sensor below the ice, through the hole they drilled to obtain flow information for the USGS 01438500 Delaware River at Montague, New Jersey site
USGS Scientists Jon Suchy and Pat Bowen working off of an ice sled, lower an acoustic sensor below the ice, through the hole they drilled to obtain flow information for the USGS 01438500 Delaware River at Montague, New Jersey site
IR view of the ice work
Looking at the USGS 01483500 Delaware River at Montague, New Jersey through an Infra-red camera which shows the differences in the ice as shades of color. The red circles along the bottom are the boreholes where the warmer water below is exposed to the surface.
Looking at the USGS 01483500 Delaware River at Montague, New Jersey through an Infra-red camera which shows the differences in the ice as shades of color. The red circles along the bottom are the boreholes where the warmer water below is exposed to the surface.
Montague Ice Probe
USGS Scientist Karl Braun lowers an Acoustic Probe below the ice to collect the flow data for the USGS 01438500 Delaware River at Montague, New Jersey site
USGS Scientist Karl Braun lowers an Acoustic Probe below the ice to collect the flow data for the USGS 01438500 Delaware River at Montague, New Jersey site
Montague Ice Drilling
USGS Scientists Patric Bowen and Jon Suchy drill a Borehole in the ice on the Delaware river at USGS 01438500 Delaware River at Montague, New Jersey
USGS Scientists Patric Bowen and Jon Suchy drill a Borehole in the ice on the Delaware river at USGS 01438500 Delaware River at Montague, New Jersey
Delaware Ice Measurement wide
Two USGS Scientists standing on the frozen Delaware River preparing to make an ice measurement at the USGS 01438500 Delaware River at Montague, New Jersey site.
Two USGS Scientists standing on the frozen Delaware River preparing to make an ice measurement at the USGS 01438500 Delaware River at Montague, New Jersey site.
Montague Bridge Ice
Looking downstream along the frozen river at the Montague bridge and the USGS 01438500 Delaware River at Montague, New Jersey site
Looking downstream along the frozen river at the Montague bridge and the USGS 01438500 Delaware River at Montague, New Jersey site
Delaware Ice Measurement Sensor
Looking at the Acoustic Dopler Current Profiler (ADCP) being used to measure the flow below the ice next to a traditional wading rod inn front of the borehole in in the ice at USGS 01438500 Delaware River at Montague, New Jersey
Looking at the Acoustic Dopler Current Profiler (ADCP) being used to measure the flow below the ice next to a traditional wading rod inn front of the borehole in in the ice at USGS 01438500 Delaware River at Montague, New Jersey
Delaware Ice Measurement Sampling
USGS scientists Patrick Bowen and Jon Suchy collecting flow data through a borehole in the ice at USGS 01438500 Delaware River at Montague, New Jersey
USGS scientists Patrick Bowen and Jon Suchy collecting flow data through a borehole in the ice at USGS 01438500 Delaware River at Montague, New Jersey
Beginning Ice Measurement
USGS Scientists Jon Suchy, Pat Bowen, and Jason Shvanda Standing on the frozen Delaware River at the USGS 01438500 Delaware River at Montague, New Jersey site with their ice measurement equipment as they prepare to make their measurement
USGS Scientists Jon Suchy, Pat Bowen, and Jason Shvanda Standing on the frozen Delaware River at the USGS 01438500 Delaware River at Montague, New Jersey site with their ice measurement equipment as they prepare to make their measurement
Delaware River Ice Cross-Section
Aerial view looking downstream at USGS site 01438500 Delaware River at Montague, New Jersey and seeing the bridge over the frozen river with a red highlighted line indicating the intended cross section for the ice measurement.
Aerial view looking downstream at USGS site 01438500 Delaware River at Montague, New Jersey and seeing the bridge over the frozen river with a red highlighted line indicating the intended cross section for the ice measurement.
Delaware Ice Boreholes
Aerial view of the Boreholes drilled in the ice to measure the flow at the USGS site 01438500 Delaware River at Montague, New Jersey
Aerial view of the Boreholes drilled in the ice to measure the flow at the USGS site 01438500 Delaware River at Montague, New Jersey