
How does Ice on Rivers and Streams Affect USGS Streamflow Data
The USSG computes streamflow several different ways at a streamgage. One very common way is to build a stage-discharge relation that computes a discharge (flow) based on a corresponding stage (elevation of the water-surface). This method relies on a hydraulic feature in the river or stream to control that relationship. The control can be a concrete weir, or natural rock outcrop or riffle.
During colder winter periods ice can form in rivers and streams altering the natural relationship between stage and discharge (flow). This can happen is a few different ways, but the USGS understands that these conditions occur.
The USGS has been measuring streamflow and dealing with documenting the effects of ice on streamflow records for well over 100-years and has developed methods for measuring, estimating and documenting when ice may be affecting the data.
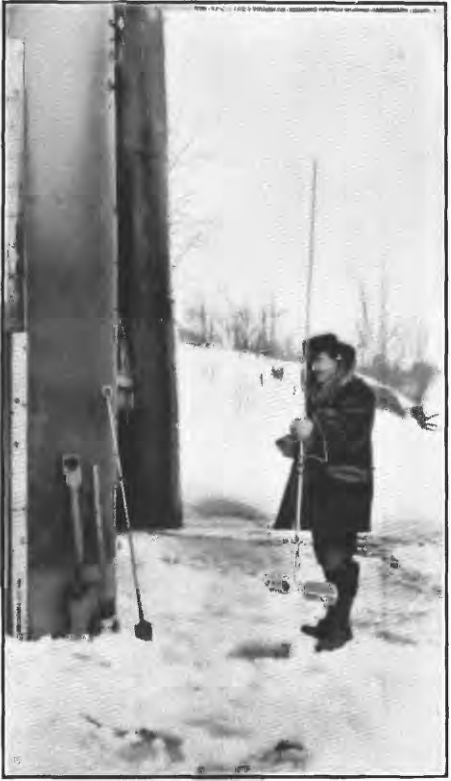
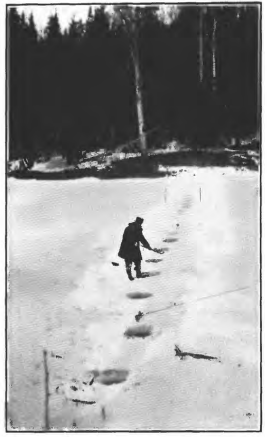
Photos from 1913 report of USGS field person preparing to make a winter ice measurement to document ice effected streamflow.
NOTE: WSP 337 USGS1913
The effects of ice on stage and discharge (flow) data can be complex and constantly changing
The variability of ice affecting flow conditions can make it difficult for USGS data users to understand what is actually happening.
Three of the more common conditions are described below
1. Ice affects the instrument ability to collect good data.
Frozen sensor, pressure transducer line, frozen stilling well and float system or surface-ice under a radar sensor causes bad readings.
USGS Radar sensors are very affective at monitoring stage during a variety of conditions but ice cover on the river can be very problematic
2. Ice builds up on the hydraulic control feature in the river or stream channel changing the relationship between stage and discharge (flow).
In this case… the increased stage elevation due to ice buildup is real and represents what is happening in the stream, but the associated discharge ( flow) is wrong because the underlying relation does not include the presence of ice in the channel.
Take a look at the example below of the data for the Rockaway River.
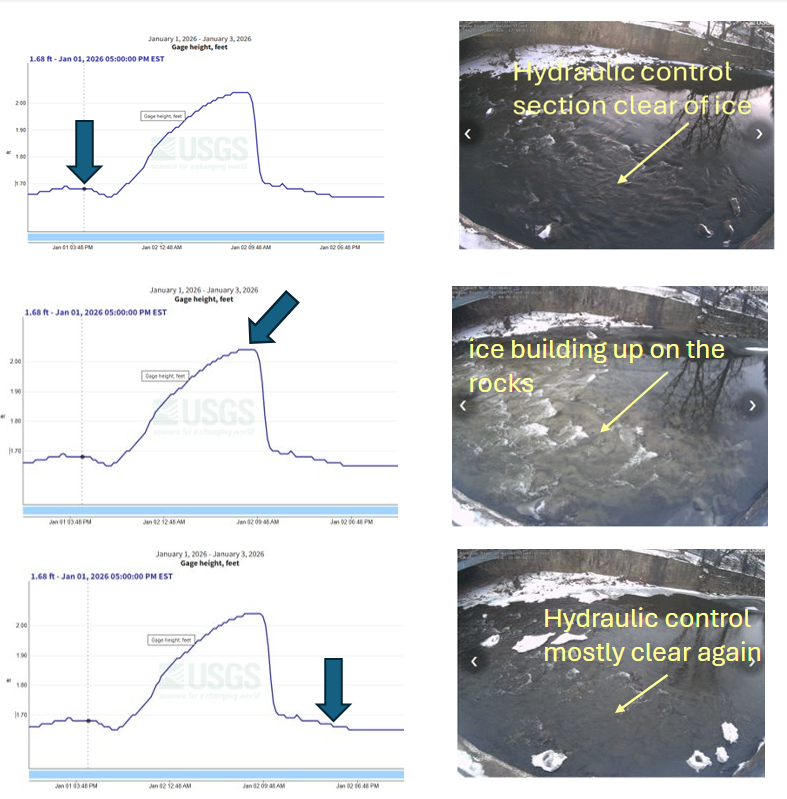
At some locations the ice effect does not simply pop off but continues to build as temperatures stay cold.
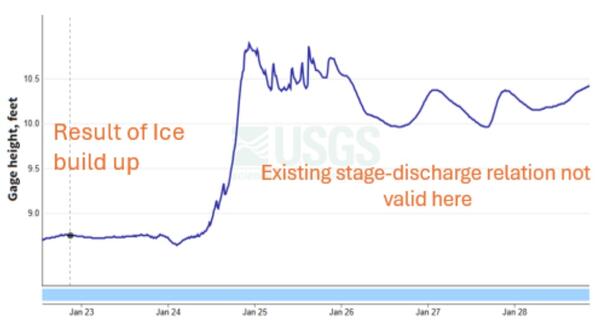
Graph here shows stage increasing because of ice build-up on the hydraulic control. Stage is correct but flow is no longer reliable.
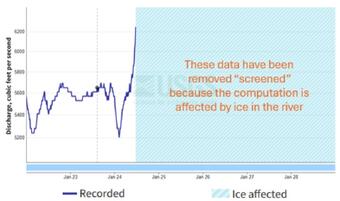
When the stage-discharge relation is affected by ice and the discharge is no longer reliable the values are typically removed “screened” from the streamgage data and graphs as shown here.
3. Combined ice affecting and Freeze/Thaw
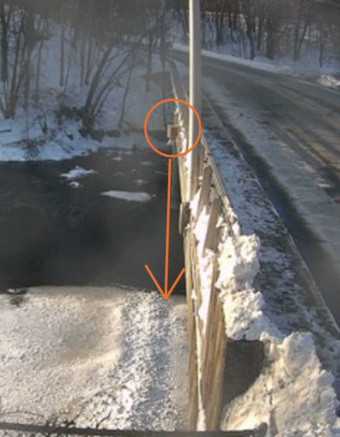
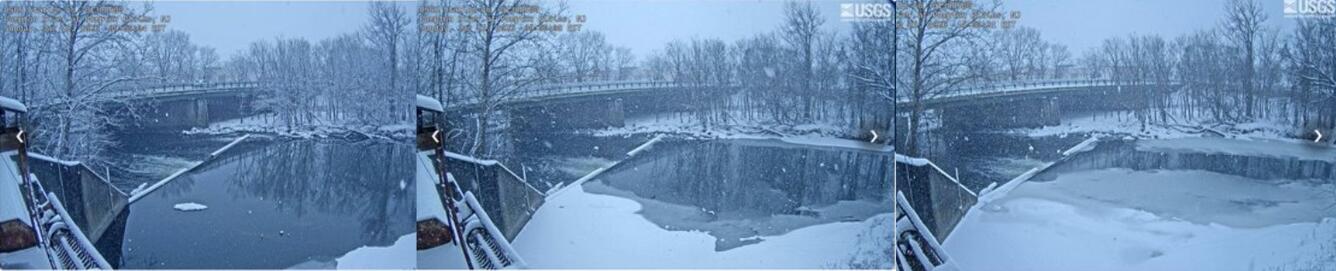
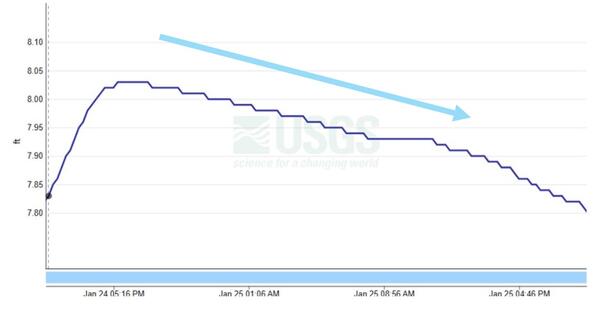
For short periods, ice can buildup throughout the reach upstream from a streamgage causing the stage and discharge (flow) to be affected in various ways. If the hydraulic control stays mostly clear as temperatures continue to stay very cold or drop, the available water in the channel can become temporarily stored as ice along the banks and the corresponding stage can actually go down indicating less discharge (flow) in the channel which may be fairly representative of the true conditions although at a higher degree of uncertainty.
In the example below the ice is visible building from the edges across the stream but the primary section of the streamgaging weir remains clear causing the recorded stage to go down as described above.
How does the USGS Determine How Much Water is Flowing

The USGS continues to monitor and adjust to the constantly changing conditions by utilizing several methods including flow routing, regression analysis and direct measurements of flow under the ice affected conditions when it is safe to do so.
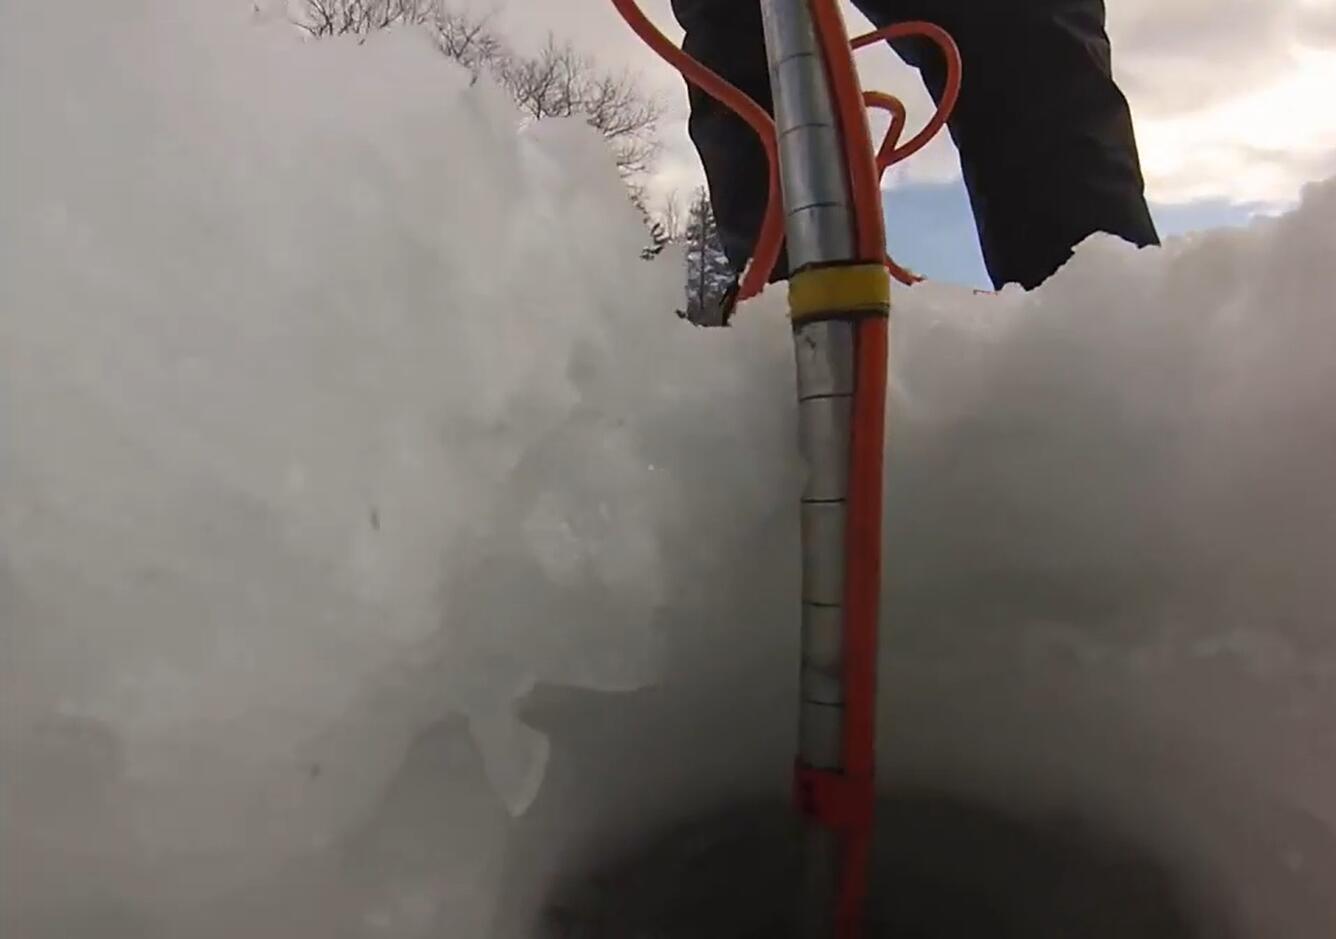
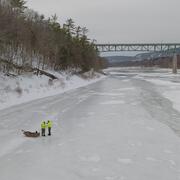
In the images above and below USGS field staff have determined the ice is solid and thick enough to safely walk on. The crew then clears the overlayed snow and drills through the ice to measure the actual streamflow under the current ice conditions.

Have you ever Wondered what the streamflow looks like under the ice
The USGS has a quick sneak peak under the ice during an Ice measurement to help answer that curiosity.
Click HERE to see the actual video
Additional River Ice Educational Information
US Army Corp of Engineers
The Cold Regions Research Engineering Laboratory is a part of the US Army Corp of Engineers Engineering Research and Development Center. They work on developing innovative solutions to science and engineering challenges related to extreme environments.
There are many types of river ice. The link below describes many of the common descriptions of River Ice.
The National Weather Service
Weather 101 slide show describing the Fundamentals of River Ice Formation.
Fundamentals of River Ice PowerPoint
Related
Delaware River at Montague Ice Affected Discharge Measurement
Related