
Long Island Precipitation
The National Oceanic and Atmospheric Administration (NOAA) National Climatic Data Center (NCDC) offers several types of climate information generated from examination of the data in the archives. These types of information include record temperatures, record precipitation and snowfall, climate extreme statistics, and other derived climate products. A collection of statistical weather and climate information tools developed and hosted by the NCDC are available. The Climate Data Online is a wonderful resource to retrieve climate products.
The Global Historical Climatology Network (GHCN) is an integrated database of climate summaries from land surface stations across the globe. There are 344 climate divisions in the contiguous United States. A climate division area for Long Island NY was selected to conveniently represent annual time scale of the following data sets: Temperature, Precipitation and Palmer Hydrological Drought Index (PHDI) (figures 16A-C). This is an interactive tool providing historical information on precipitation and temperature for selected places, from cities to states to climate regions to the contiguous United States. A menu-driven system provides the history and trend for each place. Annual data can be further broken down by month and by season.
The coastal region of Long Island from 1901-2000 had an estimated average precipitation of 44.35 inches, however during the 2005-2010 index period the estimated average precipitation was 48.38 inches.


Note: the Palmer Hydrological Drought Index (PHDI) is the monthly value (index) generated monthly that indicates the severity of a wet or dry spell. This index is based on the principles of a balance between moisture supply and demand. Man-made changes such as increased irrigation, new reservoirs, and added industrial water use were not included in the computation of this index. The index generally ranges from -6 to +6, with negative values denoting dry spells, and positive values indicating wet spells.
Cooperative Observer Network (COOP) Climate stations have more than 10,000 volunteers take daily weather observations at National Parks, seashores, mountaintops, and farms as well as in urban and suburban areas. Weather records from climate stations were downloaded from http://www.ncdc.noaa.gov/cdo-web/datatools/findstation for Long Island. Monthly summaries, at selected climate stations, were selected to provide a sense of the variability of precipitation amounts, temporally and geographically.
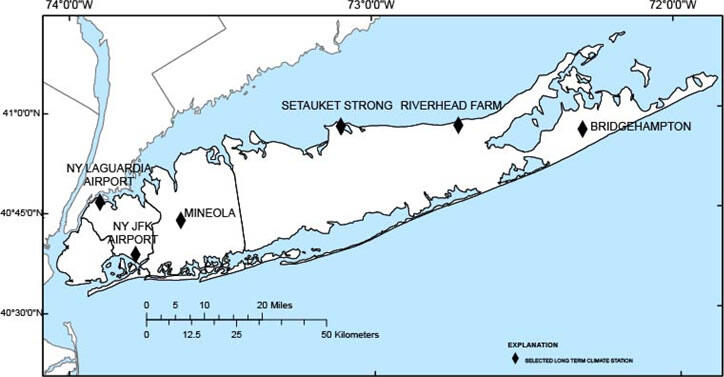
The recorded monthly summaries from 1931 to 2010, at the selected climate stations, ranged between over 67 inches in 1996 at Bridgehampton to less than 23 inches in 1965 at both Mineola and New York's LaGuardia airport (figure 17). Monthly precipitations varied from over 20 inches in the October, 2005 at Riverhead farm to less than 0.5 inches at all of the selected station and occurred over 20 times, throughout the period.
NOAA provides many forms of climatic data and Data tools to access the data collected. One example, the 1981-2010 Climate Normals are NCDC's latest three-decade averages of climatological variables, including temperature and precipitation. On Long Island, a selected Islip climate station at Islip, NY represents this 1981-2010 climate normals shown in figure 18. Monthly summaries from major airport weather stations that include a daily account of temperature extremes, degree days, precipitation and winds are also available through NOAA's Local Climatological Data Publication series at http://www.ncdc.noaa.gov/IPS/lcd/lcd.html.

Source: http://www.nws.noaa.gov/climate/xmacis.php?wfo=okx
The 1981-2010 Climate Normals index period coincides with the gridded data product from the PRISM Climate Group which gathers climate observations from a wide range of monitoring networks, applies sophisticated quality control measures, and develops spatial climate datasets to reveal short and long-term climate patterns.
Source: http://www.prism.oregonstate.edu
These gridded datasets are often used in a Geographic Information System (GIS) for analysis or as input needed in numerical models. The National Weather Service (NWS) National Digital Forecast Database (NDFD) consists of gridded forecasts of sensible weather elements (e.g., cloud cover, maximum temperature). These data are used in an interactive map which references the prism datasets and can view monthly precipitation amounts under observed, normal, departure from normal, and percent from normal conditions. The Northeast River Forecast Center also displays departures from normal and precipitation averages for each county.
The USGS National Climate Change Viewer (NCCV), is a web application used for visualizing climate change for the Continental US at the state, county and watershed scale. Last year NASA released the NEX-DCP30 dataset, which statistically downscales air temperature and precipitation from CMIP5 global models to a high resolution 30-arcsecond grid. The USGS-NCCV creators have used the air temperature and precipitation data from the 30 CMIP5 models as input to a simple water-balance model to simulate changes in the surface water balance over the historical and future time periods. Combining the climate data with the water balance data in the NCCV provides further insights into the potential for climate-driven change in water resources.
A USGS NCCV portal is available to assist the science community in conducting studies of climate change impacts at local to regional scales, and to enhance public understanding of possible future climate patterns and climate impacts at the scale of individual neighborhoods and communities.
_______________________________
Table of Contents
State of the Aquifer, Long Island, New York - Introduction
- Precipitation
- NWIS - the USGS Data Archive
- Surface Water - Streamflow
- Groundwater Levels
- Water Table and Surface Maps
- Water Use
- Groundwater Budget
- Inflow to the Groundwater System
- Outflow from the Groundwater System
Below are other science projects associated with this project.

Long Island Water Availability

NWIS - the USGS Data Archive

Long Island Surface Water - Streamflow

Long Island Groundwater Levels

Long Island Water Table and Surface Maps

Long Island Water Use

Long Island Groundwater Budget

Long Island Inflow to the Groundwater System

Long Island Outflow from the Groundwater System

Long Island Water Suitability

Long Island Water Suitability Case Studies

Long Island Groundwater System Potential Hazards
The National Oceanic and Atmospheric Administration (NOAA) National Climatic Data Center (NCDC) offers several types of climate information generated from examination of the data in the archives. These types of information include record temperatures, record precipitation and snowfall, climate extreme statistics, and other derived climate products. A collection of statistical weather and climate information tools developed and hosted by the NCDC are available. The Climate Data Online is a wonderful resource to retrieve climate products.
The Global Historical Climatology Network (GHCN) is an integrated database of climate summaries from land surface stations across the globe. There are 344 climate divisions in the contiguous United States. A climate division area for Long Island NY was selected to conveniently represent annual time scale of the following data sets: Temperature, Precipitation and Palmer Hydrological Drought Index (PHDI) (figures 16A-C). This is an interactive tool providing historical information on precipitation and temperature for selected places, from cities to states to climate regions to the contiguous United States. A menu-driven system provides the history and trend for each place. Annual data can be further broken down by month and by season.
The coastal region of Long Island from 1901-2000 had an estimated average precipitation of 44.35 inches, however during the 2005-2010 index period the estimated average precipitation was 48.38 inches.
Note: the Palmer Hydrological Drought Index (PHDI) is the monthly value (index) generated monthly that indicates the severity of a wet or dry spell. This index is based on the principles of a balance between moisture supply and demand. Man-made changes such as increased irrigation, new reservoirs, and added industrial water use were not included in the computation of this index. The index generally ranges from -6 to +6, with negative values denoting dry spells, and positive values indicating wet spells.
Cooperative Observer Network (COOP) Climate stations have more than 10,000 volunteers take daily weather observations at National Parks, seashores, mountaintops, and farms as well as in urban and suburban areas. Weather records from climate stations were downloaded from http://www.ncdc.noaa.gov/cdo-web/datatools/findstation for Long Island. Monthly summaries, at selected climate stations, were selected to provide a sense of the variability of precipitation amounts, temporally and geographically.
The recorded monthly summaries from 1931 to 2010, at the selected climate stations, ranged between over 67 inches in 1996 at Bridgehampton to less than 23 inches in 1965 at both Mineola and New York's LaGuardia airport (figure 17). Monthly precipitations varied from over 20 inches in the October, 2005 at Riverhead farm to less than 0.5 inches at all of the selected station and occurred over 20 times, throughout the period.
NOAA provides many forms of climatic data and Data tools to access the data collected. One example, the 1981-2010 Climate Normals are NCDC's latest three-decade averages of climatological variables, including temperature and precipitation. On Long Island, a selected Islip climate station at Islip, NY represents this 1981-2010 climate normals shown in figure 18. Monthly summaries from major airport weather stations that include a daily account of temperature extremes, degree days, precipitation and winds are also available through NOAA's Local Climatological Data Publication series at http://www.ncdc.noaa.gov/IPS/lcd/lcd.html.
Source: http://www.nws.noaa.gov/climate/xmacis.php?wfo=okx
The 1981-2010 Climate Normals index period coincides with the gridded data product from the PRISM Climate Group which gathers climate observations from a wide range of monitoring networks, applies sophisticated quality control measures, and develops spatial climate datasets to reveal short and long-term climate patterns.
Source: http://www.prism.oregonstate.edu
These gridded datasets are often used in a Geographic Information System (GIS) for analysis or as input needed in numerical models. The National Weather Service (NWS) National Digital Forecast Database (NDFD) consists of gridded forecasts of sensible weather elements (e.g., cloud cover, maximum temperature). These data are used in an interactive map which references the prism datasets and can view monthly precipitation amounts under observed, normal, departure from normal, and percent from normal conditions. The Northeast River Forecast Center also displays departures from normal and precipitation averages for each county.
The USGS National Climate Change Viewer (NCCV), is a web application used for visualizing climate change for the Continental US at the state, county and watershed scale. Last year NASA released the NEX-DCP30 dataset, which statistically downscales air temperature and precipitation from CMIP5 global models to a high resolution 30-arcsecond grid. The USGS-NCCV creators have used the air temperature and precipitation data from the 30 CMIP5 models as input to a simple water-balance model to simulate changes in the surface water balance over the historical and future time periods. Combining the climate data with the water balance data in the NCCV provides further insights into the potential for climate-driven change in water resources.
A USGS NCCV portal is available to assist the science community in conducting studies of climate change impacts at local to regional scales, and to enhance public understanding of possible future climate patterns and climate impacts at the scale of individual neighborhoods and communities.
_______________________________
Table of Contents
State of the Aquifer, Long Island, New York - Introduction
- Precipitation
- NWIS - the USGS Data Archive
- Surface Water - Streamflow
- Groundwater Levels
- Water Table and Surface Maps
- Water Use
- Groundwater Budget
- Inflow to the Groundwater System
- Outflow from the Groundwater System
Below are other science projects associated with this project.