
Development of a Coastal Salinity Index
A critical aspect of the uniqueness of coastal drought is the effects on the salinity dynamics of creeks, rivers, and estuaries. The location of the freshwater–saltwater interface along the coast is an important factor in the ecological and socioeconomic dynamics of coastal communities. Salinity is a critical response variable that integrates hydrologic and coastal dynamics including sea level, tides, winds, precipitation, streamflow, and tropical storms.
Evaluation of the Coastal Salinity Index (CSI) indicates that it provides additional coastal response information as compared to the SPI and the Palmer hydrologic drought index, and the CSI can be used for different estuary types and for comparison of conditions along coastlines.
CSI data release, USGS ScienceBase Catalog: https://www.sciencebase.gov/catalog/item/5852c109e4b0e2663625ed92
CSI website, USGS South Atlantic Water Science Center: https://apps.usgs.gov/sawsc/csi/index.html
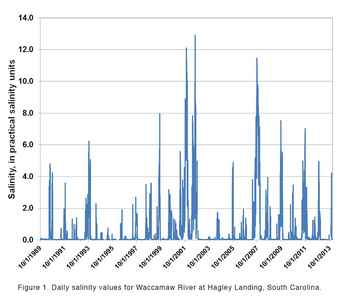
The location of the freshwater-saltwater interface in surface-water bodies is an important factor in the ecological and socio-economic dynamics of coastal communities. It influences community composition in freshwater and saltwater ecosystems, determines fisheries spawning habitat, and controls freshwater availability for municipal and industrial water intakes. These dynamics may be affected by coastal drought through changes in Vibrio bacteria impacts on shellfish harvesting and occurrence of wound infection, fish kills, harmful algal blooms, hypoxia, and beach closures. Most hydrological, agricultural, meteorological, and socio-economic drought indices were developed for upland areas and may not be appropriate indices for characterizing drought in coastal areas. Because of the uniqueness of drought impacts on coastal ecosystems, a need exists to develop a coastal drought index (CDI). The availability of many real-time and historical salinity datasets (Figure 1) provides an opportunity to leverage these datasets for the development of a salinity-based CDI.
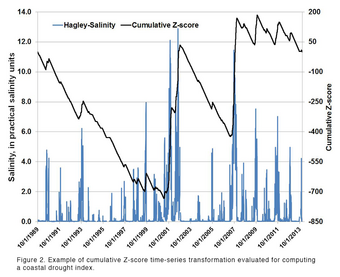
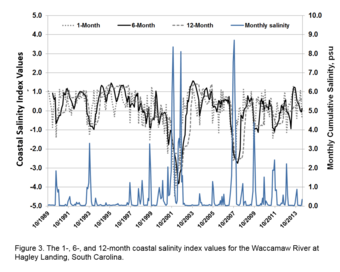
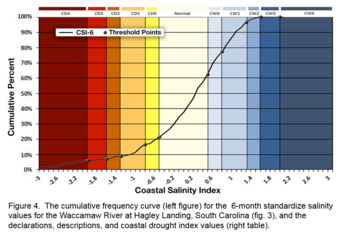
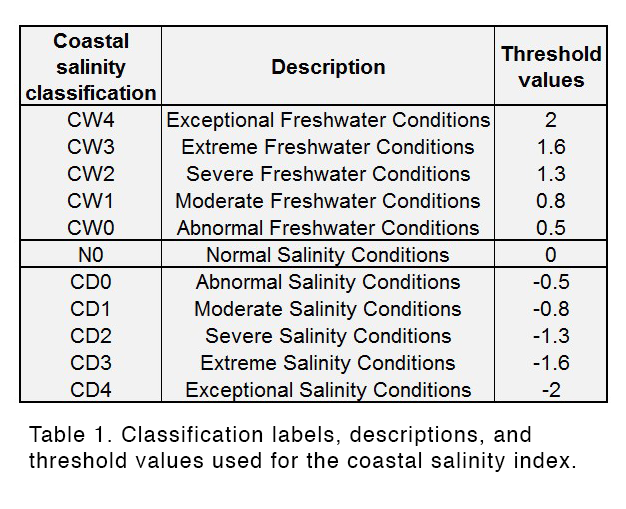
The challenge for the salinity data analysis is to characterize the salinity dynamics in response to drought while excluding responses attributable to the occasional saltwater intrusion event. Determining the best analytical approach was a discovery process of applying various statistical and numerical techniques to evaluate which techniques are most appropriate to developing a CDI (Figure 2). An approach similar to the Standardized Precipitation Index (SPI) was modified and applied to salinity data obtained from sites in South Carolina and Georgia, USA. Standardize salinity values characterizing 1-, 3-, 6-, 9-, and12-month conditions were computed from monthly salinity values (Figure 3). Thresholds similar to the SPI values were used to set incremental coastal salinity classifications (Figure 4, Table 1).
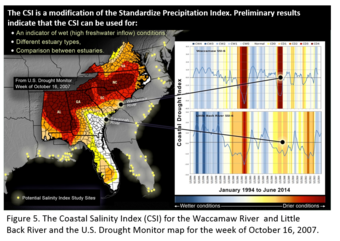
Evaluation of the CDI indicate that the index can be used for different estuary types (for example, brackish, olioghaline, or mesohaline estuaries), for regional comparison between estuaries, and as an index for wet conditions (high freshwater inflow) in addition to drought conditions. The development of the various drought characteristic intervals (1-, 3-, 6-, 9-, and12-month) allow for the CDI to be correlated with environmental response variables that occur on different time intervals. Figure 5 shows the computed CDI for the Waccamaw River (upper plot) and the Little Back River (lower plot). The background colors are the drought declarations (CD0 to CD4) and wet declarations (CW0 to CW4). The plots show there are times when there are different drought conditions in the Waccamaw River basin than the Savannah River basin. For a period in October 2007, the CDI was compared to the Drought Monitor map for the week of October 16th. The map shows that the Yadkin-Pee Dee Basin was in greater drought than the Savannah River Basin. The CDI also indicated a similar change in drought along the coast. The background map shows potential USGS real-time gaging locations where the CDI could be applied.
A critical aspect of the uniqueness of coastal drought is the effects on the salinity dynamics of creeks, rivers, and estuaries. The location of the freshwater–saltwater interface along the coast is an important factor in the ecological and socioeconomic dynamics of coastal communities. Salinity is a critical response variable that integrates hydrologic and coastal dynamics including sea level, tides, winds, precipitation, streamflow, and tropical storms.
Evaluation of the Coastal Salinity Index (CSI) indicates that it provides additional coastal response information as compared to the SPI and the Palmer hydrologic drought index, and the CSI can be used for different estuary types and for comparison of conditions along coastlines.
CSI data release, USGS ScienceBase Catalog: https://www.sciencebase.gov/catalog/item/5852c109e4b0e2663625ed92
CSI website, USGS South Atlantic Water Science Center: https://apps.usgs.gov/sawsc/csi/index.html
The location of the freshwater-saltwater interface in surface-water bodies is an important factor in the ecological and socio-economic dynamics of coastal communities. It influences community composition in freshwater and saltwater ecosystems, determines fisheries spawning habitat, and controls freshwater availability for municipal and industrial water intakes. These dynamics may be affected by coastal drought through changes in Vibrio bacteria impacts on shellfish harvesting and occurrence of wound infection, fish kills, harmful algal blooms, hypoxia, and beach closures. Most hydrological, agricultural, meteorological, and socio-economic drought indices were developed for upland areas and may not be appropriate indices for characterizing drought in coastal areas. Because of the uniqueness of drought impacts on coastal ecosystems, a need exists to develop a coastal drought index (CDI). The availability of many real-time and historical salinity datasets (Figure 1) provides an opportunity to leverage these datasets for the development of a salinity-based CDI.
The challenge for the salinity data analysis is to characterize the salinity dynamics in response to drought while excluding responses attributable to the occasional saltwater intrusion event. Determining the best analytical approach was a discovery process of applying various statistical and numerical techniques to evaluate which techniques are most appropriate to developing a CDI (Figure 2). An approach similar to the Standardized Precipitation Index (SPI) was modified and applied to salinity data obtained from sites in South Carolina and Georgia, USA. Standardize salinity values characterizing 1-, 3-, 6-, 9-, and12-month conditions were computed from monthly salinity values (Figure 3). Thresholds similar to the SPI values were used to set incremental coastal salinity classifications (Figure 4, Table 1).
Evaluation of the CDI indicate that the index can be used for different estuary types (for example, brackish, olioghaline, or mesohaline estuaries), for regional comparison between estuaries, and as an index for wet conditions (high freshwater inflow) in addition to drought conditions. The development of the various drought characteristic intervals (1-, 3-, 6-, 9-, and12-month) allow for the CDI to be correlated with environmental response variables that occur on different time intervals. Figure 5 shows the computed CDI for the Waccamaw River (upper plot) and the Little Back River (lower plot). The background colors are the drought declarations (CD0 to CD4) and wet declarations (CW0 to CW4). The plots show there are times when there are different drought conditions in the Waccamaw River basin than the Savannah River basin. For a period in October 2007, the CDI was compared to the Drought Monitor map for the week of October 16th. The map shows that the Yadkin-Pee Dee Basin was in greater drought than the Savannah River Basin. The CDI also indicated a similar change in drought along the coast. The background map shows potential USGS real-time gaging locations where the CDI could be applied.