
The Digital Shoreline Analysis System (DSAS) version 6 is a standalone application that calculates shoreline or boundary change over time. The GIS of a user’s choice is used to prepare the data for DSAS. Like previous versions, DSAS v.6 enables a user to calculate rate-of-change statistics from multiple historical shoreline positions.
Your Favorite Software for Calculating Shoreline Change Just Got Better
Digital Shoreline Analysis System version 6.1 boasts improved functionality, reinstated features, and more
Digital Shoreline Analysis System version 6.1 boasts improved functionality, reinstated features, and more
By Woods Hole Coastal and Marine Science Center
May 12, 2026
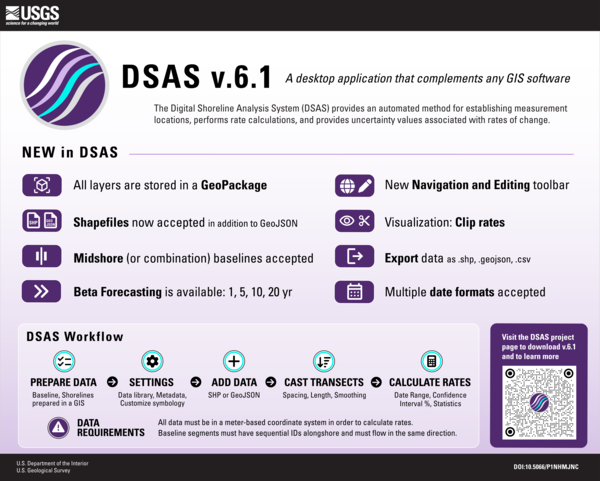
Digital Shoreline Analysis System (DSAS) version 6.1 is now available, offering new and reinstated features such as more data export options, enhanced editing tools and customizable symbology, and the ability to forecast shoreline positions.
DSAS calculates how shoreline positions—or any positional boundary—change over time.
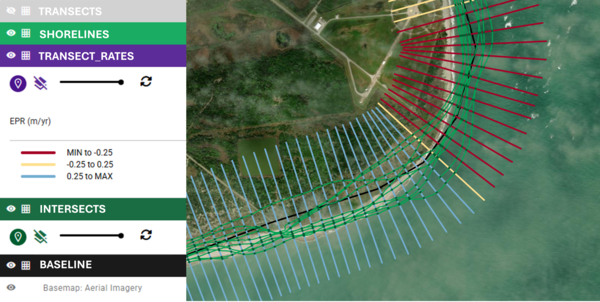
It’s used to calculate rate-of-change statistics from multiple historical shoreline positions, generate measurement transects along a baseline, and estimate uncertainties to show the reliability of results.
Although best known for shoreline‑change applications, DSAS also supports analysis of other evolving boundaries, including glacier margins, riverbanks, and land‑cover transitions.
In previous versions, DSAS was an add-in to ArcMap within Esri ArcGIS Desktop. However, when Esri ArcGIS Desktop began its decent into retirement in 2024, the DSAS development team released version 6 in response—a standalone, desktop application that complements any geographic information system, including popular choices such as QGIS, Global Mapper, and ArcGIS Pro. It was developed rapidly to meet essential user needs, with basic but reduced functionality from version 5.
As promised, DSAS version 6.1 reinstates several features and improves overall functionality.
In DSAS version 6.1, all layers are stored in a GeoPackage and can be exported as shapefiles (.shp), GeoJSON (.gpkg), and/or comma-separated values (.csv). The user can also customize data layer symbology and perform basic editing in the new navigation and editing toolbar.
Reinstated features include additional date format options, use of midshore baselines, and the ability to forecast up to 20 years into the future.
Media

Sources/Usage: Public Domain. View Media Details
Media
Sources/Usage: Public Domain. View Media Details
Sources/Usage: Public Domain. View Media Details
DSAS makes it easier to measure, understand, and anticipate shoreline changes, giving decision makers the information they need to plan for the future.
Our shorelines are constantly changing due to waves, storms, sea level change, and human activities. Understanding these changes is essential for protecting communities and managing resources.
As DSAS continues to evolve, version 6.1 reflects the development team’s commitment to meeting user needs. The reinstated features, improved flexibility, and expanded export options ensure users can continue producing reliable shoreline change analyses.
Whether applied to long-term coastal research or management planning, DSAS remains a trusted tool for transforming historical shoreline data into meaningful insights.
Visit the DSAS web page for additional resources and information.
Related

Digital Shoreline Analysis System (DSAS)
Software for calculating positional boundary change over time The Digital Shoreline Analysis System (DSAS) version 6 is a standalone application that calculates shoreline or boundary change over time. The GIS of a user’s choice is used to prepare the data for DSAS. Like previous versions, DSAS v.6 enables a user to calculate rate-of-change statistics from multiple historical shoreline positions...
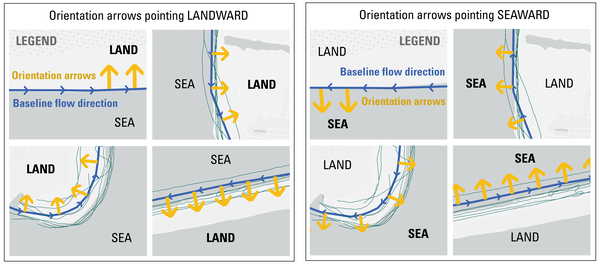
DSAS Landward vs Seaward
The Digital Shoreline Analysis System (DSAS) version 6 is a standalone application that calculates shoreline or boundary change over time. The GIS of a user’s choice is used to prepare the data for DSAS. Like previous versions, DSAS v.6 enables a user to calculate rate-of-change statistics from multiple historical shoreline positions.
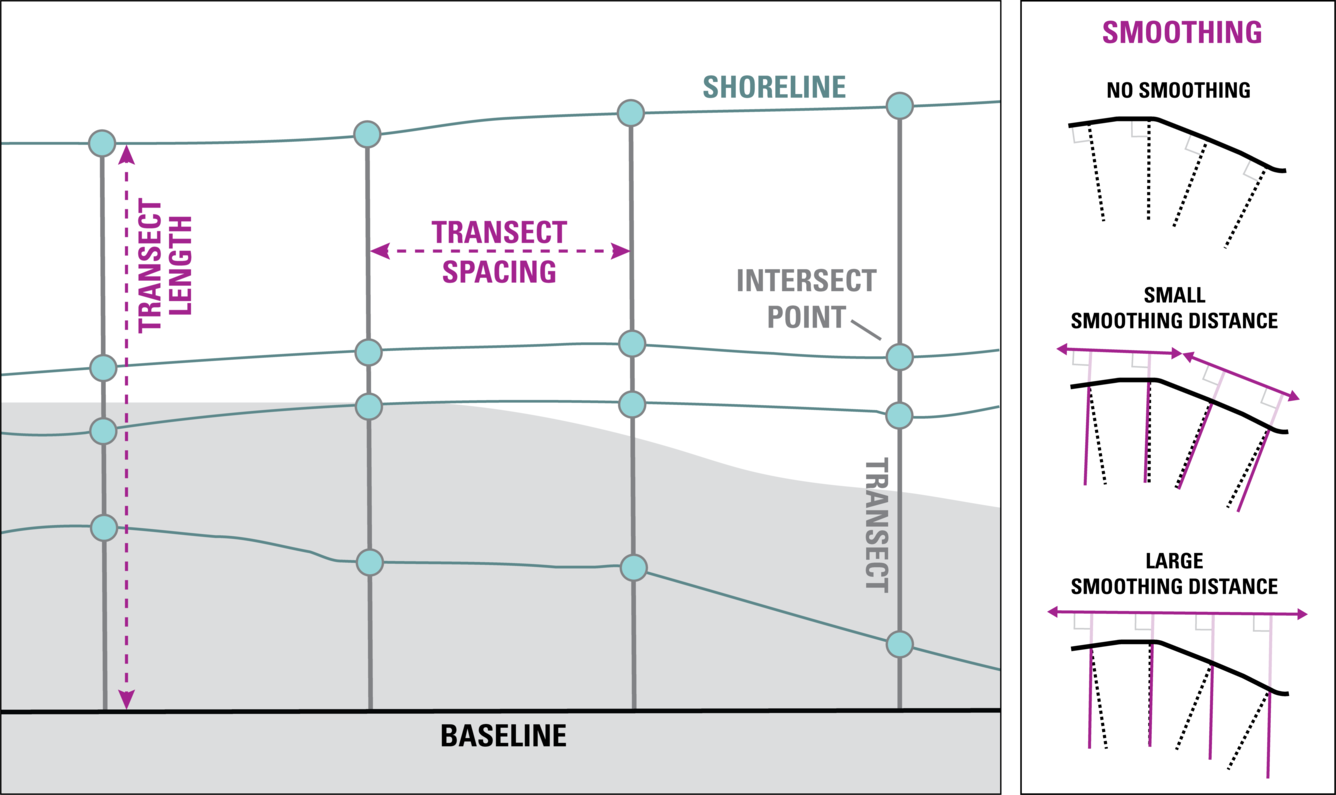
DSAS Elements
DSAS generates transects that are cast perpendicular to the reference baseline to intersect shorelines at a user-specified spacing alongshore.
DSAS generates transects that are cast perpendicular to the reference baseline to intersect shorelines at a user-specified spacing alongshore.
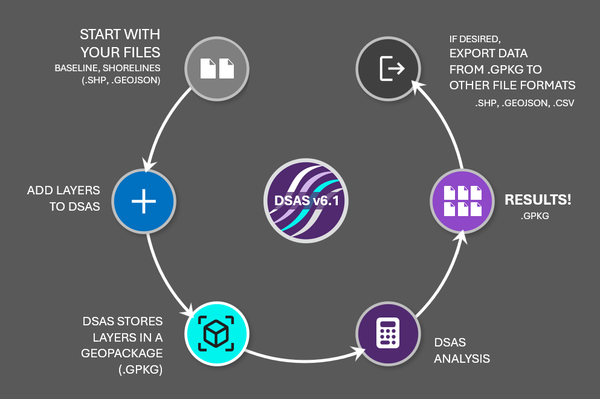
DSAS step by step
The Digital Shoreline Analysis System (DSAS) version 6 is a standalone application that calculates shoreline or boundary change over time. The GIS of a user’s choice is used to prepare the data for DSAS. Like previous versions, DSAS v.6 enables a user to calculate rate-of-change statistics from multiple historical shoreline positions.
The Digital Shoreline Analysis System (DSAS) version 6 is a standalone application that calculates shoreline or boundary change over time. The GIS of a user’s choice is used to prepare the data for DSAS. Like previous versions, DSAS v.6 enables a user to calculate rate-of-change statistics from multiple historical shoreline positions.
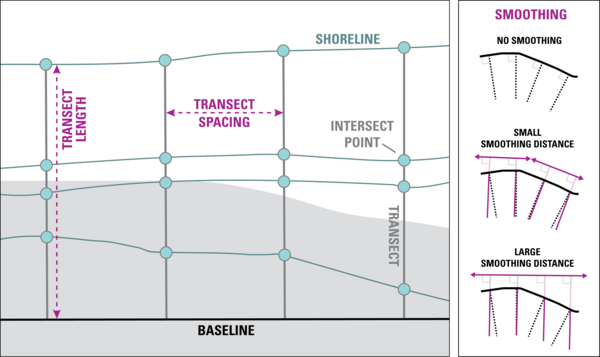
DSAS v6.1 Infographic
The Digital Shoreline Analysis System (DSAS) version 6 is a standalone application that calculates shoreline or boundary change over time. The GIS of a user’s choice is used to prepare the data for DSAS. Like previous versions, DSAS v.6 enables a user to calculate rate-of-change statistics from multiple historical shoreline positions.
The Digital Shoreline Analysis System (DSAS) version 6 is a standalone application that calculates shoreline or boundary change over time. The GIS of a user’s choice is used to prepare the data for DSAS. Like previous versions, DSAS v.6 enables a user to calculate rate-of-change statistics from multiple historical shoreline positions.
DSAS Sample Data
The Digital Shoreline Analysis System (DSAS) version 6 is a standalone application that calculates shoreline or boundary change over time. The GIS of a user’s choice is used to prepare the data for DSAS. Like previous versions, DSAS v.6 enables a user to calculate rate-of-change statistics from multiple historical shoreline positions.
The Digital Shoreline Analysis System (DSAS) version 6 is a standalone application that calculates shoreline or boundary change over time. The GIS of a user’s choice is used to prepare the data for DSAS. Like previous versions, DSAS v.6 enables a user to calculate rate-of-change statistics from multiple historical shoreline positions.

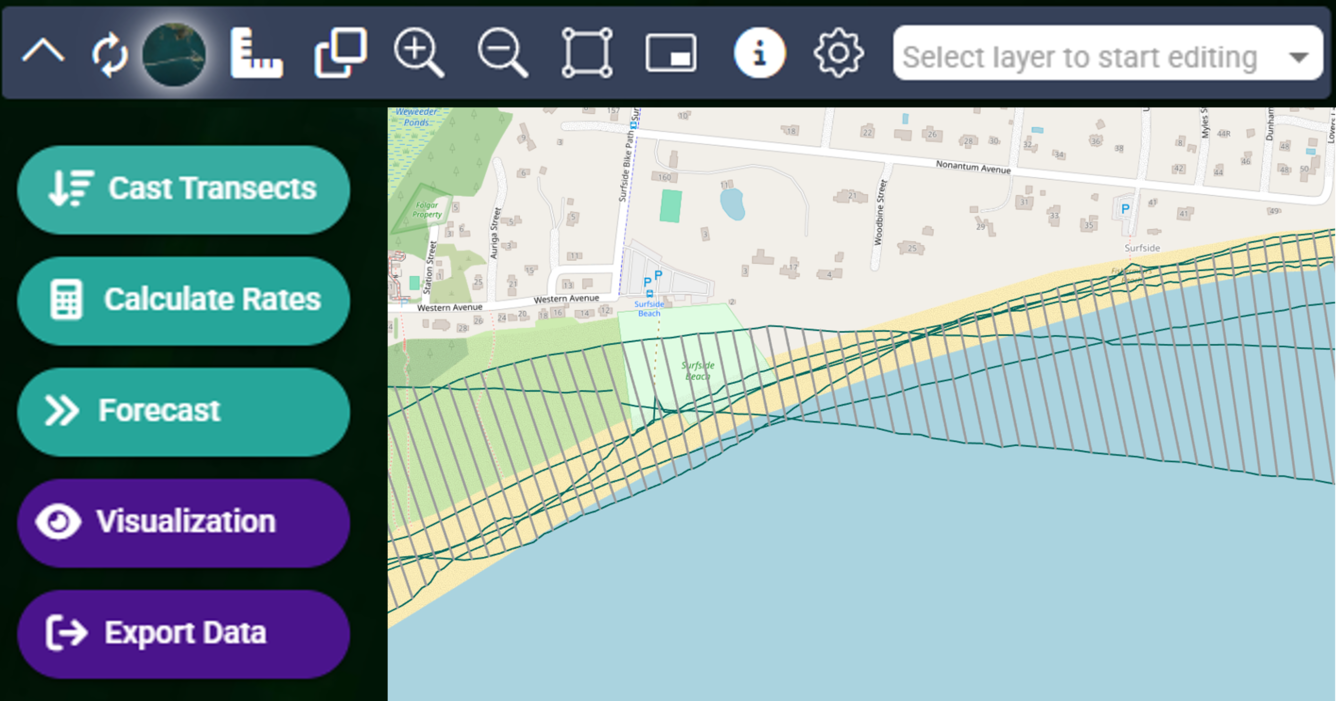
DSAS Software
The Digital Shoreline Analysis System (DSAS) version 6 is a standalone application that calculates shoreline or boundary change over time. The GIS of a user’s choice is used to prepare the data for DSAS. Like previous versions, DSAS v.6 enables a user to calculate rate-of-change statistics from multiple historical shoreline positions.
The Digital Shoreline Analysis System (DSAS) version 6 is a standalone application that calculates shoreline or boundary change over time. The GIS of a user’s choice is used to prepare the data for DSAS. Like previous versions, DSAS v.6 enables a user to calculate rate-of-change statistics from multiple historical shoreline positions.
Related
Digital Shoreline Analysis System (DSAS)
Software for calculating positional boundary change over time The Digital Shoreline Analysis System (DSAS) version 6 is a standalone application that calculates shoreline or boundary change over time. The GIS of a user’s choice is used to prepare the data for DSAS. Like previous versions, DSAS v.6 enables a user to calculate rate-of-change statistics from multiple historical shoreline positions...
DSAS Landward vs Seaward
The Digital Shoreline Analysis System (DSAS) version 6 is a standalone application that calculates shoreline or boundary change over time. The GIS of a user’s choice is used to prepare the data for DSAS. Like previous versions, DSAS v.6 enables a user to calculate rate-of-change statistics from multiple historical shoreline positions.
The Digital Shoreline Analysis System (DSAS) version 6 is a standalone application that calculates shoreline or boundary change over time. The GIS of a user’s choice is used to prepare the data for DSAS. Like previous versions, DSAS v.6 enables a user to calculate rate-of-change statistics from multiple historical shoreline positions.
DSAS Elements
DSAS generates transects that are cast perpendicular to the reference baseline to intersect shorelines at a user-specified spacing alongshore.
DSAS generates transects that are cast perpendicular to the reference baseline to intersect shorelines at a user-specified spacing alongshore.
DSAS step by step
The Digital Shoreline Analysis System (DSAS) version 6 is a standalone application that calculates shoreline or boundary change over time. The GIS of a user’s choice is used to prepare the data for DSAS. Like previous versions, DSAS v.6 enables a user to calculate rate-of-change statistics from multiple historical shoreline positions.
The Digital Shoreline Analysis System (DSAS) version 6 is a standalone application that calculates shoreline or boundary change over time. The GIS of a user’s choice is used to prepare the data for DSAS. Like previous versions, DSAS v.6 enables a user to calculate rate-of-change statistics from multiple historical shoreline positions.
DSAS v6.1 Infographic
The Digital Shoreline Analysis System (DSAS) version 6 is a standalone application that calculates shoreline or boundary change over time. The GIS of a user’s choice is used to prepare the data for DSAS. Like previous versions, DSAS v.6 enables a user to calculate rate-of-change statistics from multiple historical shoreline positions.
The Digital Shoreline Analysis System (DSAS) version 6 is a standalone application that calculates shoreline or boundary change over time. The GIS of a user’s choice is used to prepare the data for DSAS. Like previous versions, DSAS v.6 enables a user to calculate rate-of-change statistics from multiple historical shoreline positions.
DSAS Sample Data
The Digital Shoreline Analysis System (DSAS) version 6 is a standalone application that calculates shoreline or boundary change over time. The GIS of a user’s choice is used to prepare the data for DSAS. Like previous versions, DSAS v.6 enables a user to calculate rate-of-change statistics from multiple historical shoreline positions.
The Digital Shoreline Analysis System (DSAS) version 6 is a standalone application that calculates shoreline or boundary change over time. The GIS of a user’s choice is used to prepare the data for DSAS. Like previous versions, DSAS v.6 enables a user to calculate rate-of-change statistics from multiple historical shoreline positions.
DSAS Software
The Digital Shoreline Analysis System (DSAS) version 6 is a standalone application that calculates shoreline or boundary change over time. The GIS of a user’s choice is used to prepare the data for DSAS. Like previous versions, DSAS v.6 enables a user to calculate rate-of-change statistics from multiple historical shoreline positions.
The Digital Shoreline Analysis System (DSAS) version 6 is a standalone application that calculates shoreline or boundary change over time. The GIS of a user’s choice is used to prepare the data for DSAS. Like previous versions, DSAS v.6 enables a user to calculate rate-of-change statistics from multiple historical shoreline positions.