
Predicting the phenology of invasive grasses under a changing climate to inform mapping and management
Cheatgrass, an invasive annual grass, reduces ecosystem productivity, negatively impacts biodiversity, and is increasingly problematic in higher elevation ecosystems with climate change. Cheatgrass phenology (that is, the timing of yearly growth and lifespan) varies greatly with elevation, climate, and weather from year to year, which can make management planning difficult and reduce the ability to map cheatgrass using satellite imagery in mountainous ecosystems. To address this issue, we are creating landscape-scale phenology forecasts and annual maps of cheatgrass abundance using high-resolution timelapse camera observations, gridded climate data, and fine-scale satellite imagery selected based on phenology predictions.
The Problem
Nonnative annual grasses such as cheatgrass are negatively impacting ecosystems at higher elevations and more northern latitudes, and climate change will likely further exacerbate this issue. Managers want to accurately map where new cheatgrass invasions may be occurring, especially after disturbances such as fire. There are currently numerous spatial products aimed to map and detect non-native annual species, mainly across the Great Basin. However, the timing of green-up and die-off of invasive grasses can vary greatly with drought, latitude, elevation, and yearly fluctuations in temperature, reducing the ability to accurately map invasive grasses using aerial or satellite imagery across mountainous terrain.
Our Approach
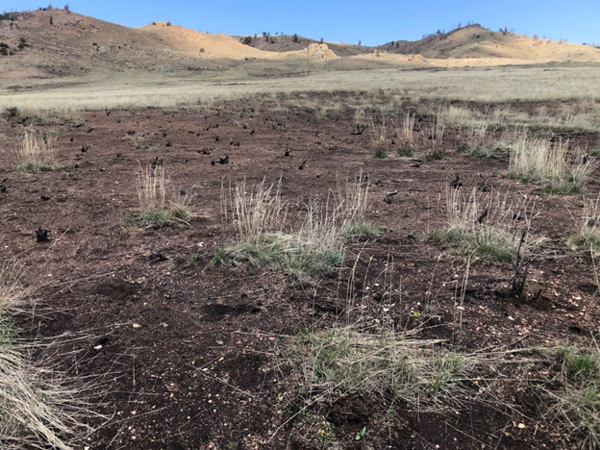
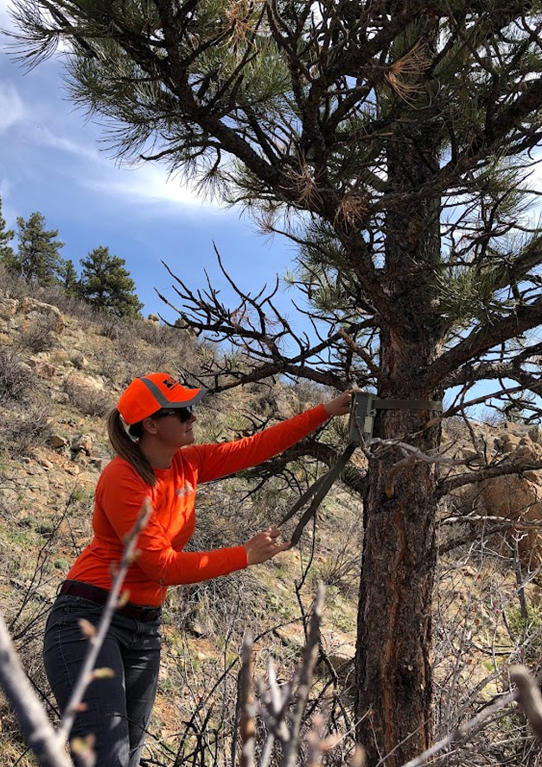
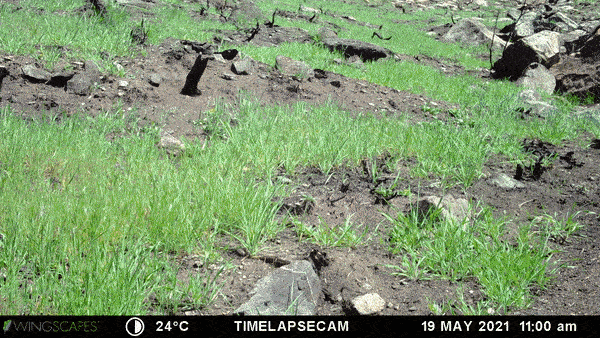
We are creating fine-resolution, landscape-scale predictions of the phenology of cheatgrass, based on data from volunteer science observations, long-term monitoring experiments, and time-lapse camera imagery from cameras we have deployed across elevational gradients throughout the western USA. We are developing predictive models by matching phenology observations to downscaled daylength, temperature, and precipitation data to identify how these drivers influence the timing of peak green-up and die-off of cheatgrass. We will then use these relationships to develop phenological forecasts to predict the timing of peak greenness and senescence across latitudinal and altitudinal gradients and over multiple years. Finally, these predictions will be used to select fine-scale spatial and temporal resolution satellite imagery over time periods where differences in the phenology of cheatgrass and native vegetation are predicted to be greatest in a given year, and thus easiest to detect and delineate using remotely sensed data. These maps will be compared to on-the-ground vegetation plot data collected in summer 2023. We will specifically use this information to detect potential cheatgrass invasion and herbicide treatment effectiveness following the Mullen fire, which burned over 175,000 acres in southern Wyoming in 2020. These methods can also be expanded to monitor potential cheatgrass invasion following the large Cameron Peak and East Troublesome fires that also occurred in 2020 in Colorado.

Invasive Annual Grass (IAG) Spatial Dataset Compilation and Synthesis
Cheatgrass, an invasive annual grass, reduces ecosystem productivity, negatively impacts biodiversity, and is increasingly problematic in higher elevation ecosystems with climate change. Cheatgrass phenology (that is, the timing of yearly growth and lifespan) varies greatly with elevation, climate, and weather from year to year, which can make management planning difficult and reduce the ability to map cheatgrass using satellite imagery in mountainous ecosystems. To address this issue, we are creating landscape-scale phenology forecasts and annual maps of cheatgrass abundance using high-resolution timelapse camera observations, gridded climate data, and fine-scale satellite imagery selected based on phenology predictions.
The Problem
Nonnative annual grasses such as cheatgrass are negatively impacting ecosystems at higher elevations and more northern latitudes, and climate change will likely further exacerbate this issue. Managers want to accurately map where new cheatgrass invasions may be occurring, especially after disturbances such as fire. There are currently numerous spatial products aimed to map and detect non-native annual species, mainly across the Great Basin. However, the timing of green-up and die-off of invasive grasses can vary greatly with drought, latitude, elevation, and yearly fluctuations in temperature, reducing the ability to accurately map invasive grasses using aerial or satellite imagery across mountainous terrain.
Our Approach
We are creating fine-resolution, landscape-scale predictions of the phenology of cheatgrass, based on data from volunteer science observations, long-term monitoring experiments, and time-lapse camera imagery from cameras we have deployed across elevational gradients throughout the western USA. We are developing predictive models by matching phenology observations to downscaled daylength, temperature, and precipitation data to identify how these drivers influence the timing of peak green-up and die-off of cheatgrass. We will then use these relationships to develop phenological forecasts to predict the timing of peak greenness and senescence across latitudinal and altitudinal gradients and over multiple years. Finally, these predictions will be used to select fine-scale spatial and temporal resolution satellite imagery over time periods where differences in the phenology of cheatgrass and native vegetation are predicted to be greatest in a given year, and thus easiest to detect and delineate using remotely sensed data. These maps will be compared to on-the-ground vegetation plot data collected in summer 2023. We will specifically use this information to detect potential cheatgrass invasion and herbicide treatment effectiveness following the Mullen fire, which burned over 175,000 acres in southern Wyoming in 2020. These methods can also be expanded to monitor potential cheatgrass invasion following the large Cameron Peak and East Troublesome fires that also occurred in 2020 in Colorado.