
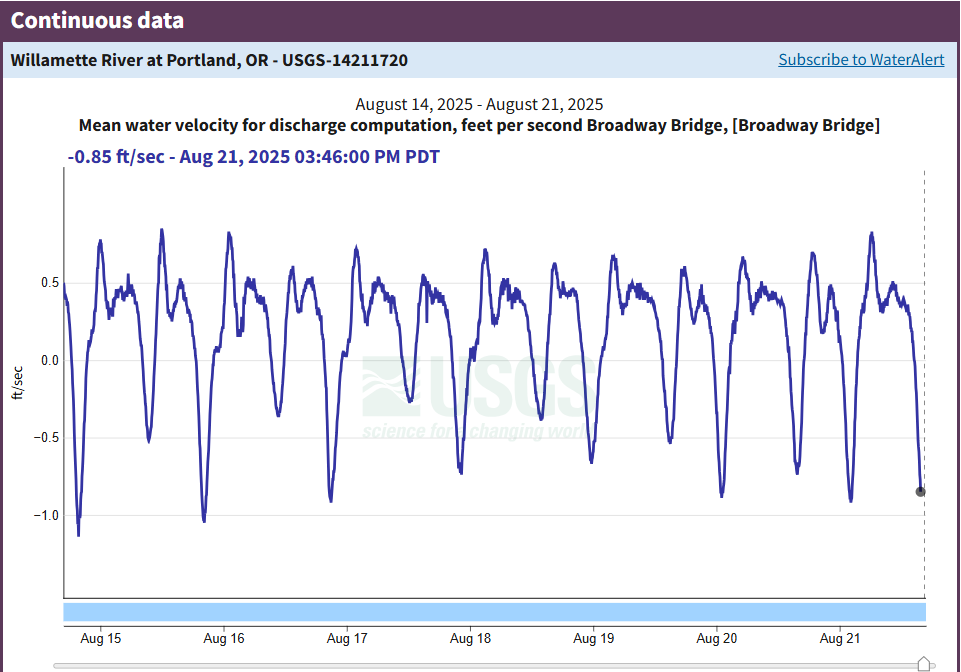
Mean water velocity for discharge computation, feet per second Broadway Bridge
Detailed Description
This scatter plot shows average velocity readings for the Willamette River in Portland from August 15–21. During this low-flow period, tides from the Columbia River briefly reverse the Willamette’s flow, resulting in negative velocity readings each day. See what the velocity readings are right now.
Sources/Usage
Public Domain.
Related
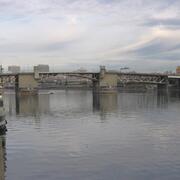
Measuring Willamette River streamflow in Portland
Learn about one of Oregon's most relied upon streamflow gages.
Related
Measuring Willamette River streamflow in Portland
Learn about one of Oregon's most relied upon streamflow gages.