
Interactive Tableau supplement for 'Climate futures for lizards and snakes in western North America may result in new species management issues'
Introduction
This data visualization displays the results of distribution models for 130 snake and lizard species in western North America under six time-by-climate scenarios. Past (1901-1930) and recent (1981-2010) distributions can be compared to predicted future (2040-2069 and 2070-2100) distributions under two climate scenarios (RCP 4.5 and RCP 8.5).
Dashboard Descriptions
Single-species Model Results
This dashboard displays summary data from the perspective of an individual species. A bar plot displays the variable importance of monthly temperature and precipitation for the ensemble distribution model. A scatter plot displays performance of the eight different distribution models.

Single-species Range Change by State
The second dashboard displays summary data between the recent and a selected time-by-climate scenario from the perspective of an individual species.

Multi-species Range Change and Model Results
This dashboard displays summary information for all modeled species in each figure.

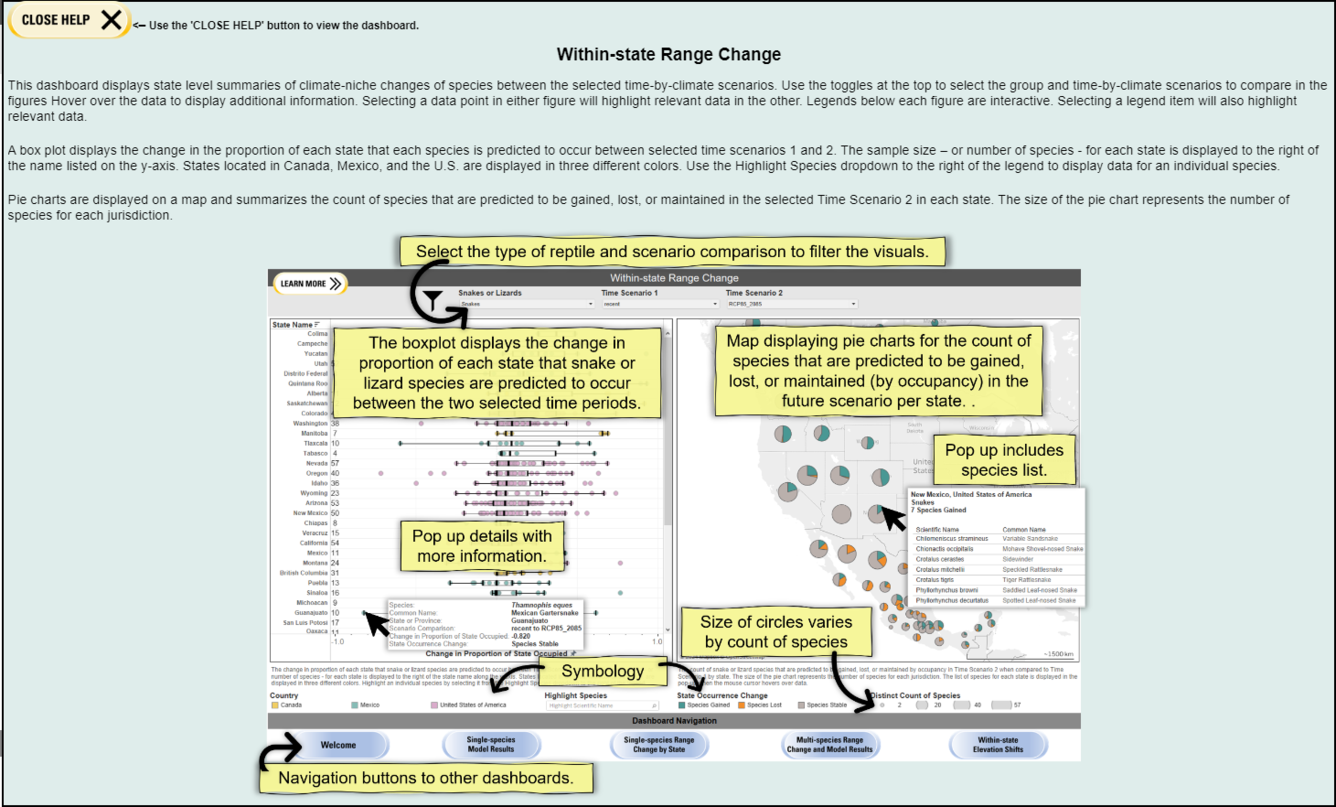
Within-state Range Change
On this dashboard, users can explore state level summaries of climate-niche changes of species between the selected time-by-climate scenarios.
Within-state Elevational Shifts
The final dashboard displays summary information about the elevational changes for species within each state.
