
Acoustic backscatter and bathymetry maps
By Woods Hole Coastal and Marine Science Center
2011 (approx.)

Detailed Description
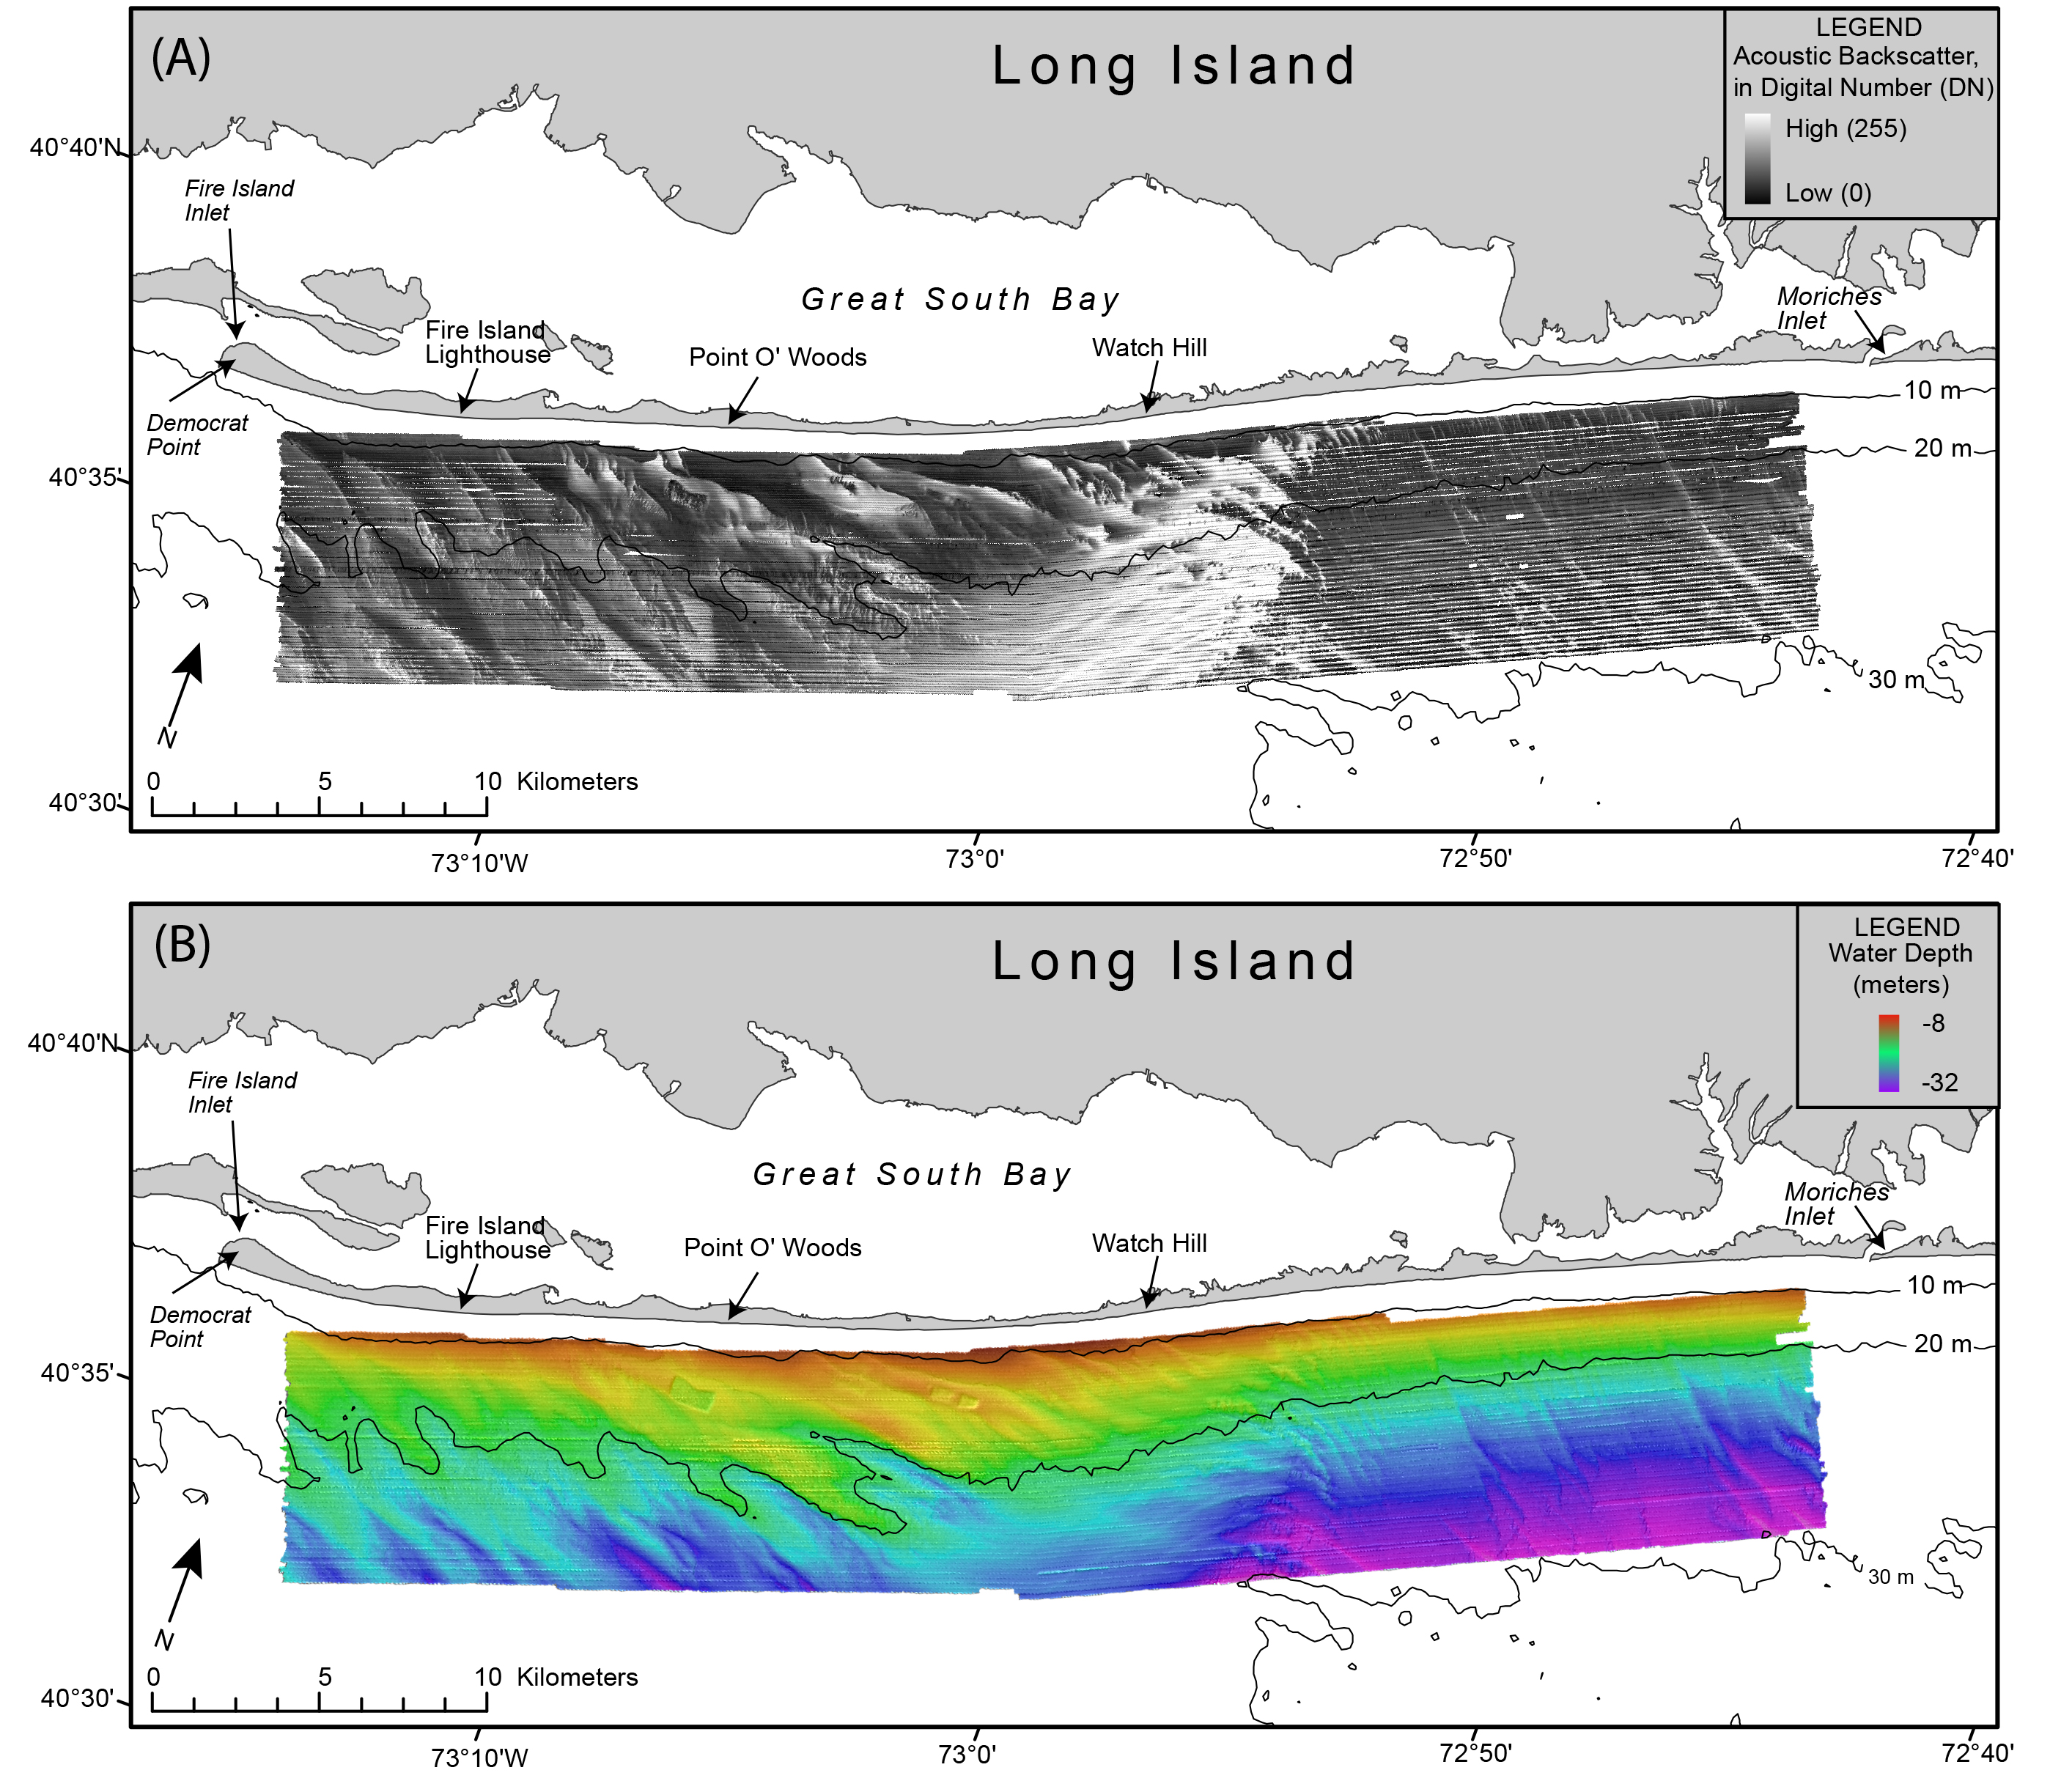
Maps showing (A) acoustic backscatter and (B) bathymetry collected with the inteferomentric sonar. High backscatter is displayed by light tones and low backscatter is displayed as dark tones within the backscatter image. Regional bathymetric contours are in meters. West of Watch Hill, the modern sand deposit is organized into a series of shoreface-attached ridges oriented at oblique angles to the shoreline.
Sources/Usage
Public Domain.