
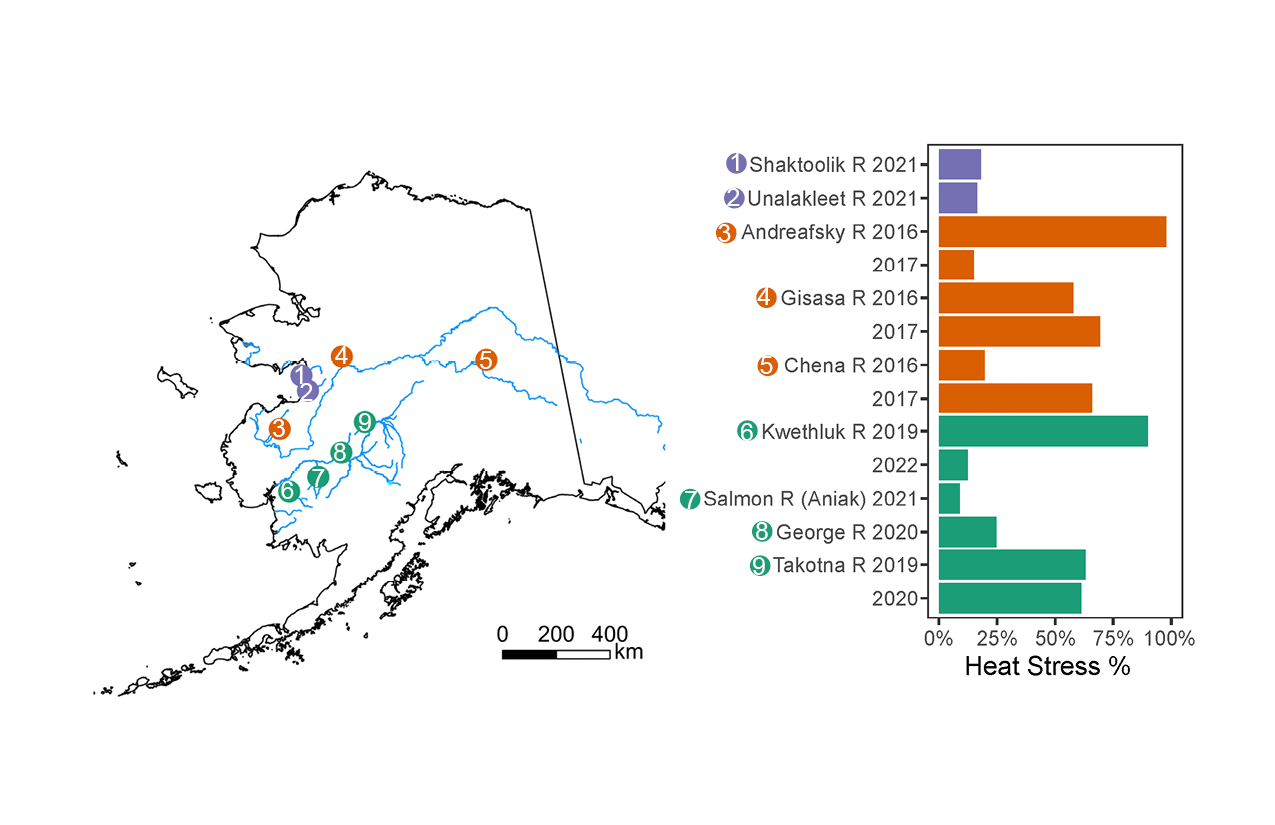
Bar plot showing the percentage of Chinook salmon with evidence of heat stress across Alaska
By Alaska Science Center
2025 (approx.)

Detailed Description
Bar plot showing the percentage of Chinook salmon with evidence of heat stress in each group based on the heat shock protein 70 (HSP70) protein concentration data. Map indicates sample collection locations. Sample groups are arranged by region from north to south: Norton Sound (purple), Yukon (orange), and Kuskokwim (green). Figure from the article "Migration water temperature and heat stress assessments in western Alaska Chinook salmon overlapping the 2019 heatwave".
Sources/Usage
Public Domain.
Related

Fish and Aquatic Ecology
Fish and aquatic habitats in Alaska support important commercial, sport, and subsistence fisheries and provide forage fish that support wildlife populations. The USGS Alaska Science Center conducts interdisciplinary research to inform local, state, federal, and international policy makers regarding conservation of fish, aquatic species, and their habitats. We work collaboratively with hydrologists...

Heat Stress in Alaska's Pacific Salmon
Alaska's freshwater spans a wide range of summer water temperatures, from ice-cold glacier water to warm rivers that routinely reach stressful levels for salmon, exceeding 18°C/64°F and even surpassing 21°C/70°F. Pacific salmon population trends are also varied and include declines in many Chinook salmon populations. Salmon declines are kitchen table issues because salmon fishing is key to the...
Related
Fish and Aquatic Ecology
Fish and aquatic habitats in Alaska support important commercial, sport, and subsistence fisheries and provide forage fish that support wildlife populations. The USGS Alaska Science Center conducts interdisciplinary research to inform local, state, federal, and international policy makers regarding conservation of fish, aquatic species, and their habitats. We work collaboratively with hydrologists...
Heat Stress in Alaska's Pacific Salmon
Alaska's freshwater spans a wide range of summer water temperatures, from ice-cold glacier water to warm rivers that routinely reach stressful levels for salmon, exceeding 18°C/64°F and even surpassing 21°C/70°F. Pacific salmon population trends are also varied and include declines in many Chinook salmon populations. Salmon declines are kitchen table issues because salmon fishing is key to the...