
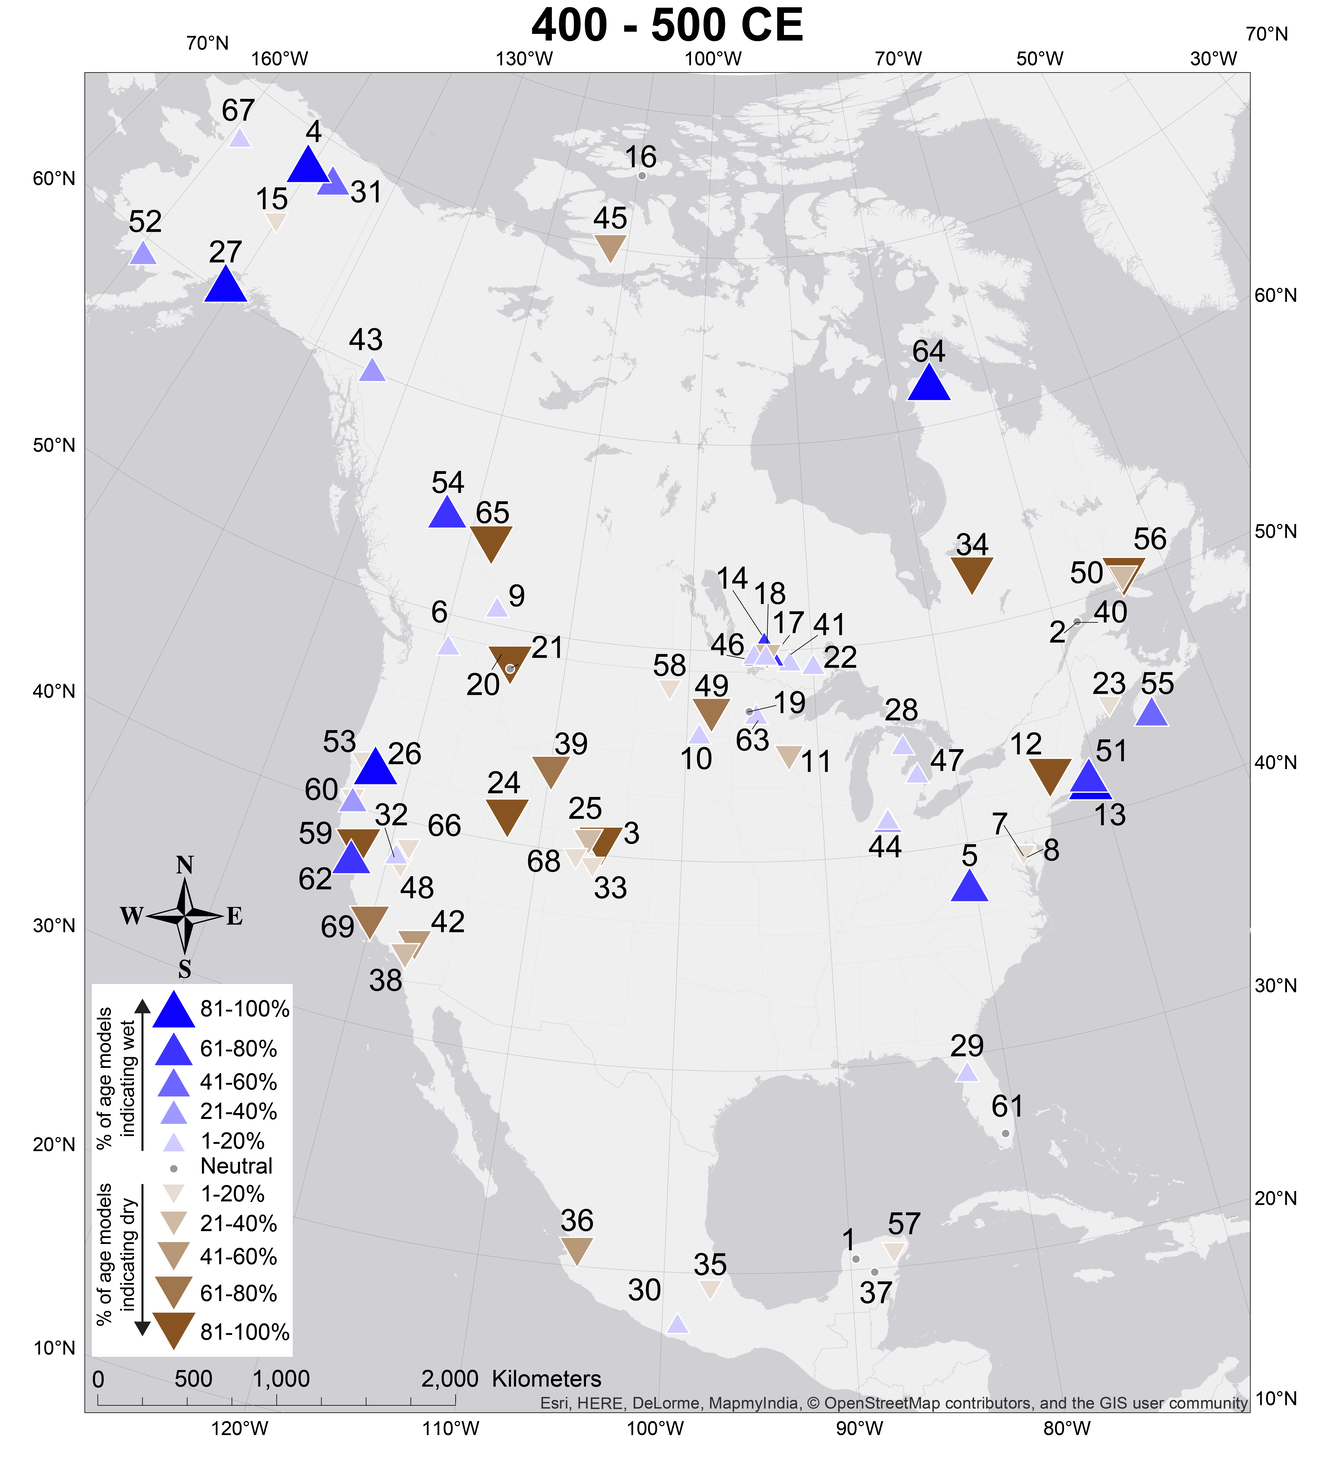
Centennial-Scale Hydroclimate Anomalies, 400-500CE
By Florence Bascom Geoscience Center
2018 (approx.)
Detailed Description
The time range on the top of each map is the century for which proxy values were averaged and anomalies were calculated. Blue triangles pointed upward indicate a wet climate anomaly in the proxy data, and brown triangles pointed downward indicate a dry anomaly. The size and shading of each symbol scale with the percent of age model possibilities that indicate an anomaly, with larger, darker symbols indicating a greater portion of age models that align a particular hydroclimate anomaly with that century.
Sources/Usage
Public Domain.