
Chart of water level coherence
By Woods Hole Coastal and Marine Science Center
2013 (approx.)
Detailed Description
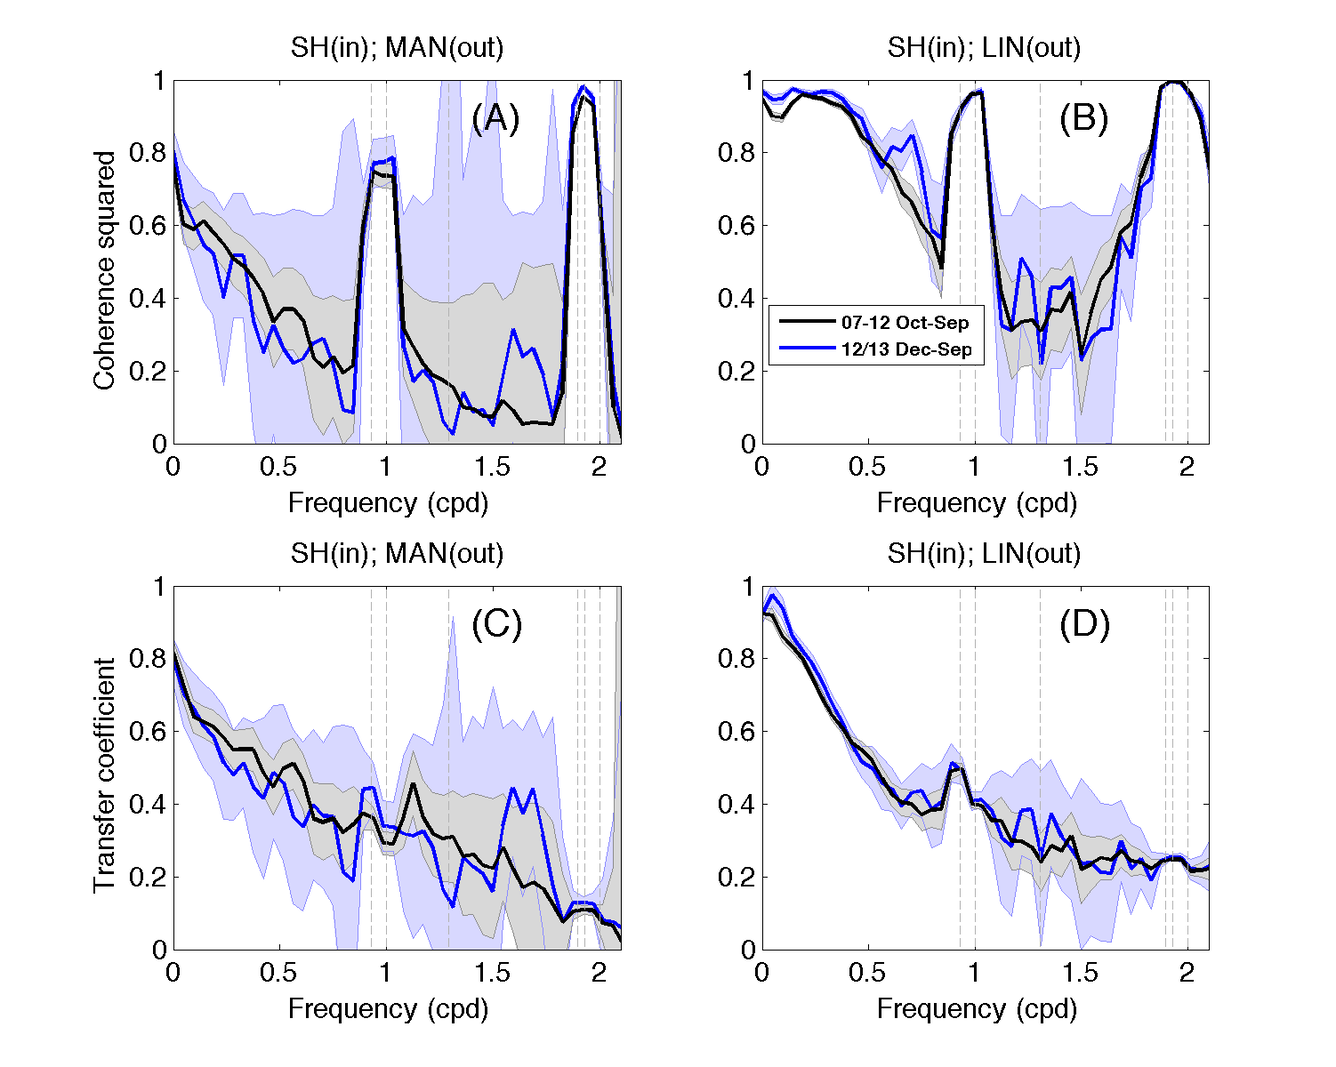
Water level coherence (A, B) and transfer function (C, D) between SH and MAN and between SH and LIN for the October-September period for 2007-2012 (pre-Hurricane Sandy) and December-September 2012-2013 (post-Sandy). The shaded areas denote uncertainty envelopes for coherence and transfer function, for short-term (blue) and long-term(grey) records. SH data is the input spectrum and MAN and LIN are output spectra.
Sources/Usage
Public Domain.