
Compilation of thermal maps during summit eruption
By Kīlauea
Detailed Description
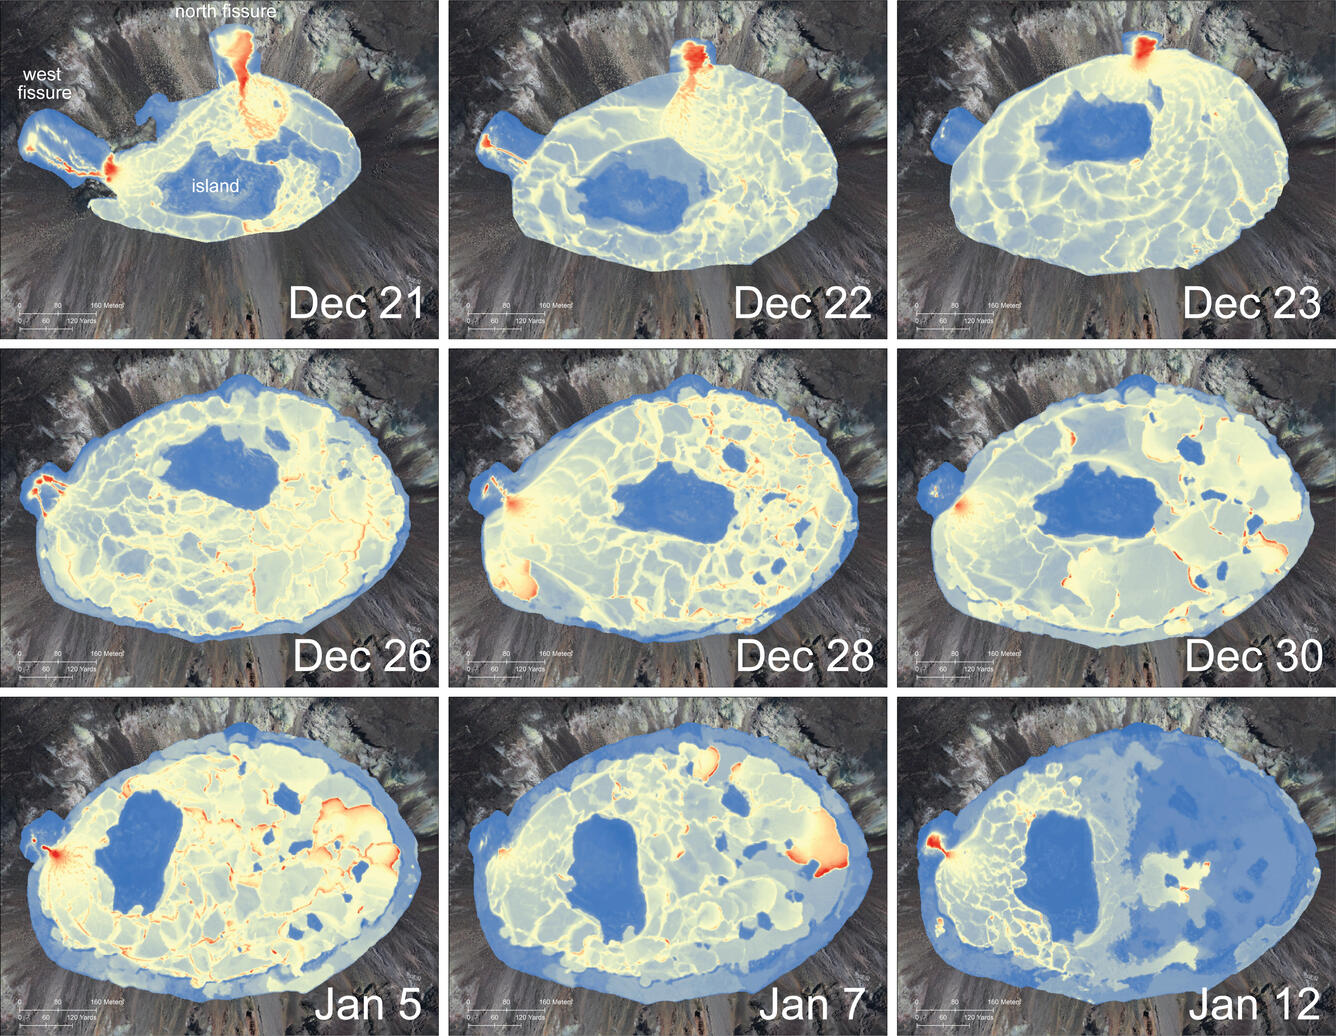
This compilation shows nine thermal maps created for the ongoing eruption in Halema‘uma‘u, at the summit of Kīlauea, which began on December 20, 2020. The maps show the rapid emplacement and growth of the lake in the initial days, followed by a switch in the dominant vent from the north fissure to the west fissure on December 26. The main island shifts and rotates, presumably controlled by the lake currents. The last two maps (Jan 7 and 12) shows the stagnation and cooling of the eastern half of the lake surface. The color range shows the relative temperatures across the lake, with blue colors indicative of cooler temperatures and red colors indicative of warmer temperatures. USGS maps by M. Patrick.
Sources/Usage
Public Domain.