
Cumulative distribution of wave-current combined bottom stress
Detailed Description
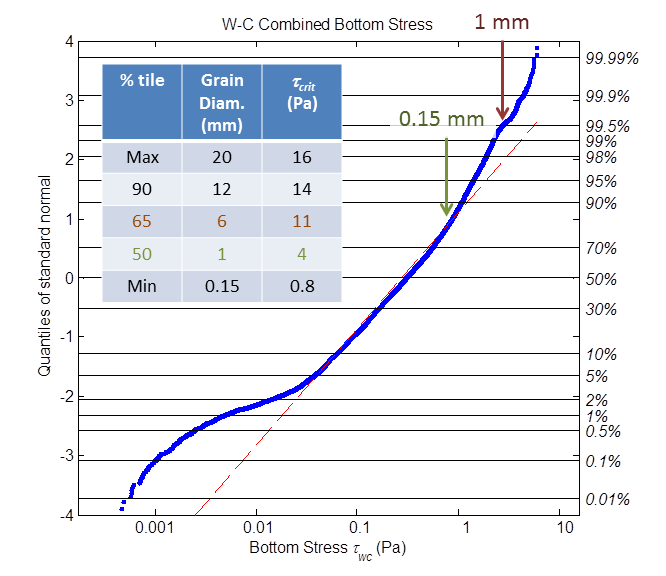
Cumulative distribution of wave-current combined bottom stress (blue dots) estimated from acoustic Doppler current-meter measurements at the wreck site, plotted in log-probability coordinates. The dashed red line represents a Gaussian distribution. The inset table lists the (approximate) frequency of exceedence (percent with smaller diameters) for grain diameters (mm) and associated critical shear stresses (τcrit). The data indicate that bottom stresses are below the critical shear stress (τcrit) for mobilizing carbonate fine sands with diameters of 0.15 mm about 84% of the time, and are below the critical shear stress for mobilizing the median grain size (1-mm granules) 99.5% of the time. No stresses were calculated that were capable of moving the coarsest 35% of bottom sediment.
Sources/Usage
Public Domain.