
Earth Observing-1 (EO-1) Hyperion Hyperspectral
Detailed Description
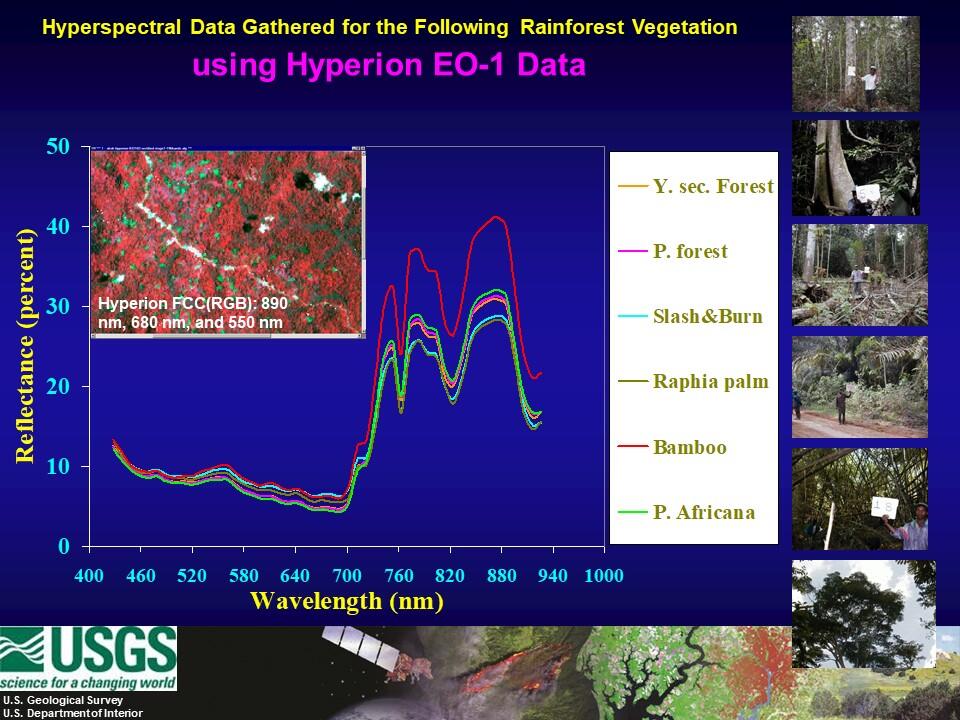
Figure 9: Hyperspectral Hyperion data acquired over African rainforest are used to study spectral characteristics of the rainforest vegetation as illustrated. For example, highest spectral reflectivity in the near infrared (NIR) bands is for the bamboo forests whereas the same vegetation has greatest absorption in the visible. In contrast the slash-and-burn agricultural fields have high reflectivity in the visible red bands, low reflectivity in the NIR, and high reflectivity in the 2000 to 2400 nm range. All these subtle and not so subtle difference are characterized through qualitative and quantitative approaches. Given the rich spectral data in 100s or 1000s of hyperspectral narrowbands (HNBs) and the ability to establish unique hyperspectral vegetation indices (HVIs) using hyperspectral data such as from EO-1 Hyperion, there are many advances that can be made in study of agricultural crops and other vegetation. (Thenkabail et al. 2004 a, b)
Source:
Modified and adopted from:
Thenkabail, P.S., Enclona, E.A., Ashton, M.S., Legg, C., Jean De Dieu, M., 2004a. Hyperion, IKONOS, ALI, and ETM+ sensors in the study of African rainforests. Remote Sensing of Environment, 90:23-43.
Thenkabail, P.S., Enclona, E.A., Ashton, M.S., and Van Der Meer, V. 2004b. Accuracy Assessments of Hyperspectral Waveband Performance for Vegetation Analysis Applications. Remote Sensing of Environment, 91:2-3: 354-376.
Sources/Usage
Public Domain.
Courtesy: Prasad Thenkabail