
Example of plot from usSEABED

Detailed Description
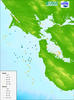
Image showing relative abundances and distributions of shells and worms off central California using component data from usSEABED. Individual data points are represented as colored circles of various sizes. Each color corresponds to either shells or worms, and varying sizes represent various degrees of membership; definitions of colors and sizes are listed in the legend.
Sources/Usage
Public Domain.
Related

usSEABED data format and content
The USGS data release for the usSEABED database enables search and download of six interlinked files of output data and a seventh file that provides linked information about the original data sources. These files can be downloaded in their entirety and are also searchable through an online interface that allows for search and selection either through a GIS display or through a web form. Both...
Related
usSEABED data format and content
The USGS data release for the usSEABED database enables search and download of six interlinked files of output data and a seventh file that provides linked information about the original data sources. These files can be downloaded in their entirety and are also searchable through an online interface that allows for search and selection either through a GIS display or through a web form. Both...