
Flow cytometric dot plot

Detailed Description
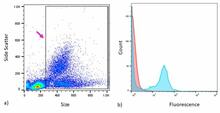
Figure 4. a) Flow cytometric dot plot showing isolated and gated (arrow) white blood cells (WBC) from an American kestrel hatchling after exposure to a flame retardant. Red blood cells at the origin are gated out of the analysis of the protein marker for T helper WBC. b) An analysis of the gated WBC stained for the CD4-fluorochrome marker indicating the presence of the immune cell type. Histogram overlays of the control isotype (red) and anti-CD4 fluorescence label (blue) allows for measuring the immune response by the cells analogous to chicken T helper cells.
Sources/Usage
Public Domain.
Related

Studying Immune Responses in the American Kestrel (Falco sparverius)
The objectives of this study are to (1) investigate whether the immune system will respond to chemical stressors, such as new flame retardant compounds, and (2) determine if such chemical stressors influence white blood cells (WBC) responses after exposure to a viral pathogen mimicking bird flu.
Related
Studying Immune Responses in the American Kestrel (Falco sparverius)
The objectives of this study are to (1) investigate whether the immune system will respond to chemical stressors, such as new flame retardant compounds, and (2) determine if such chemical stressors influence white blood cells (WBC) responses after exposure to a viral pathogen mimicking bird flu.