
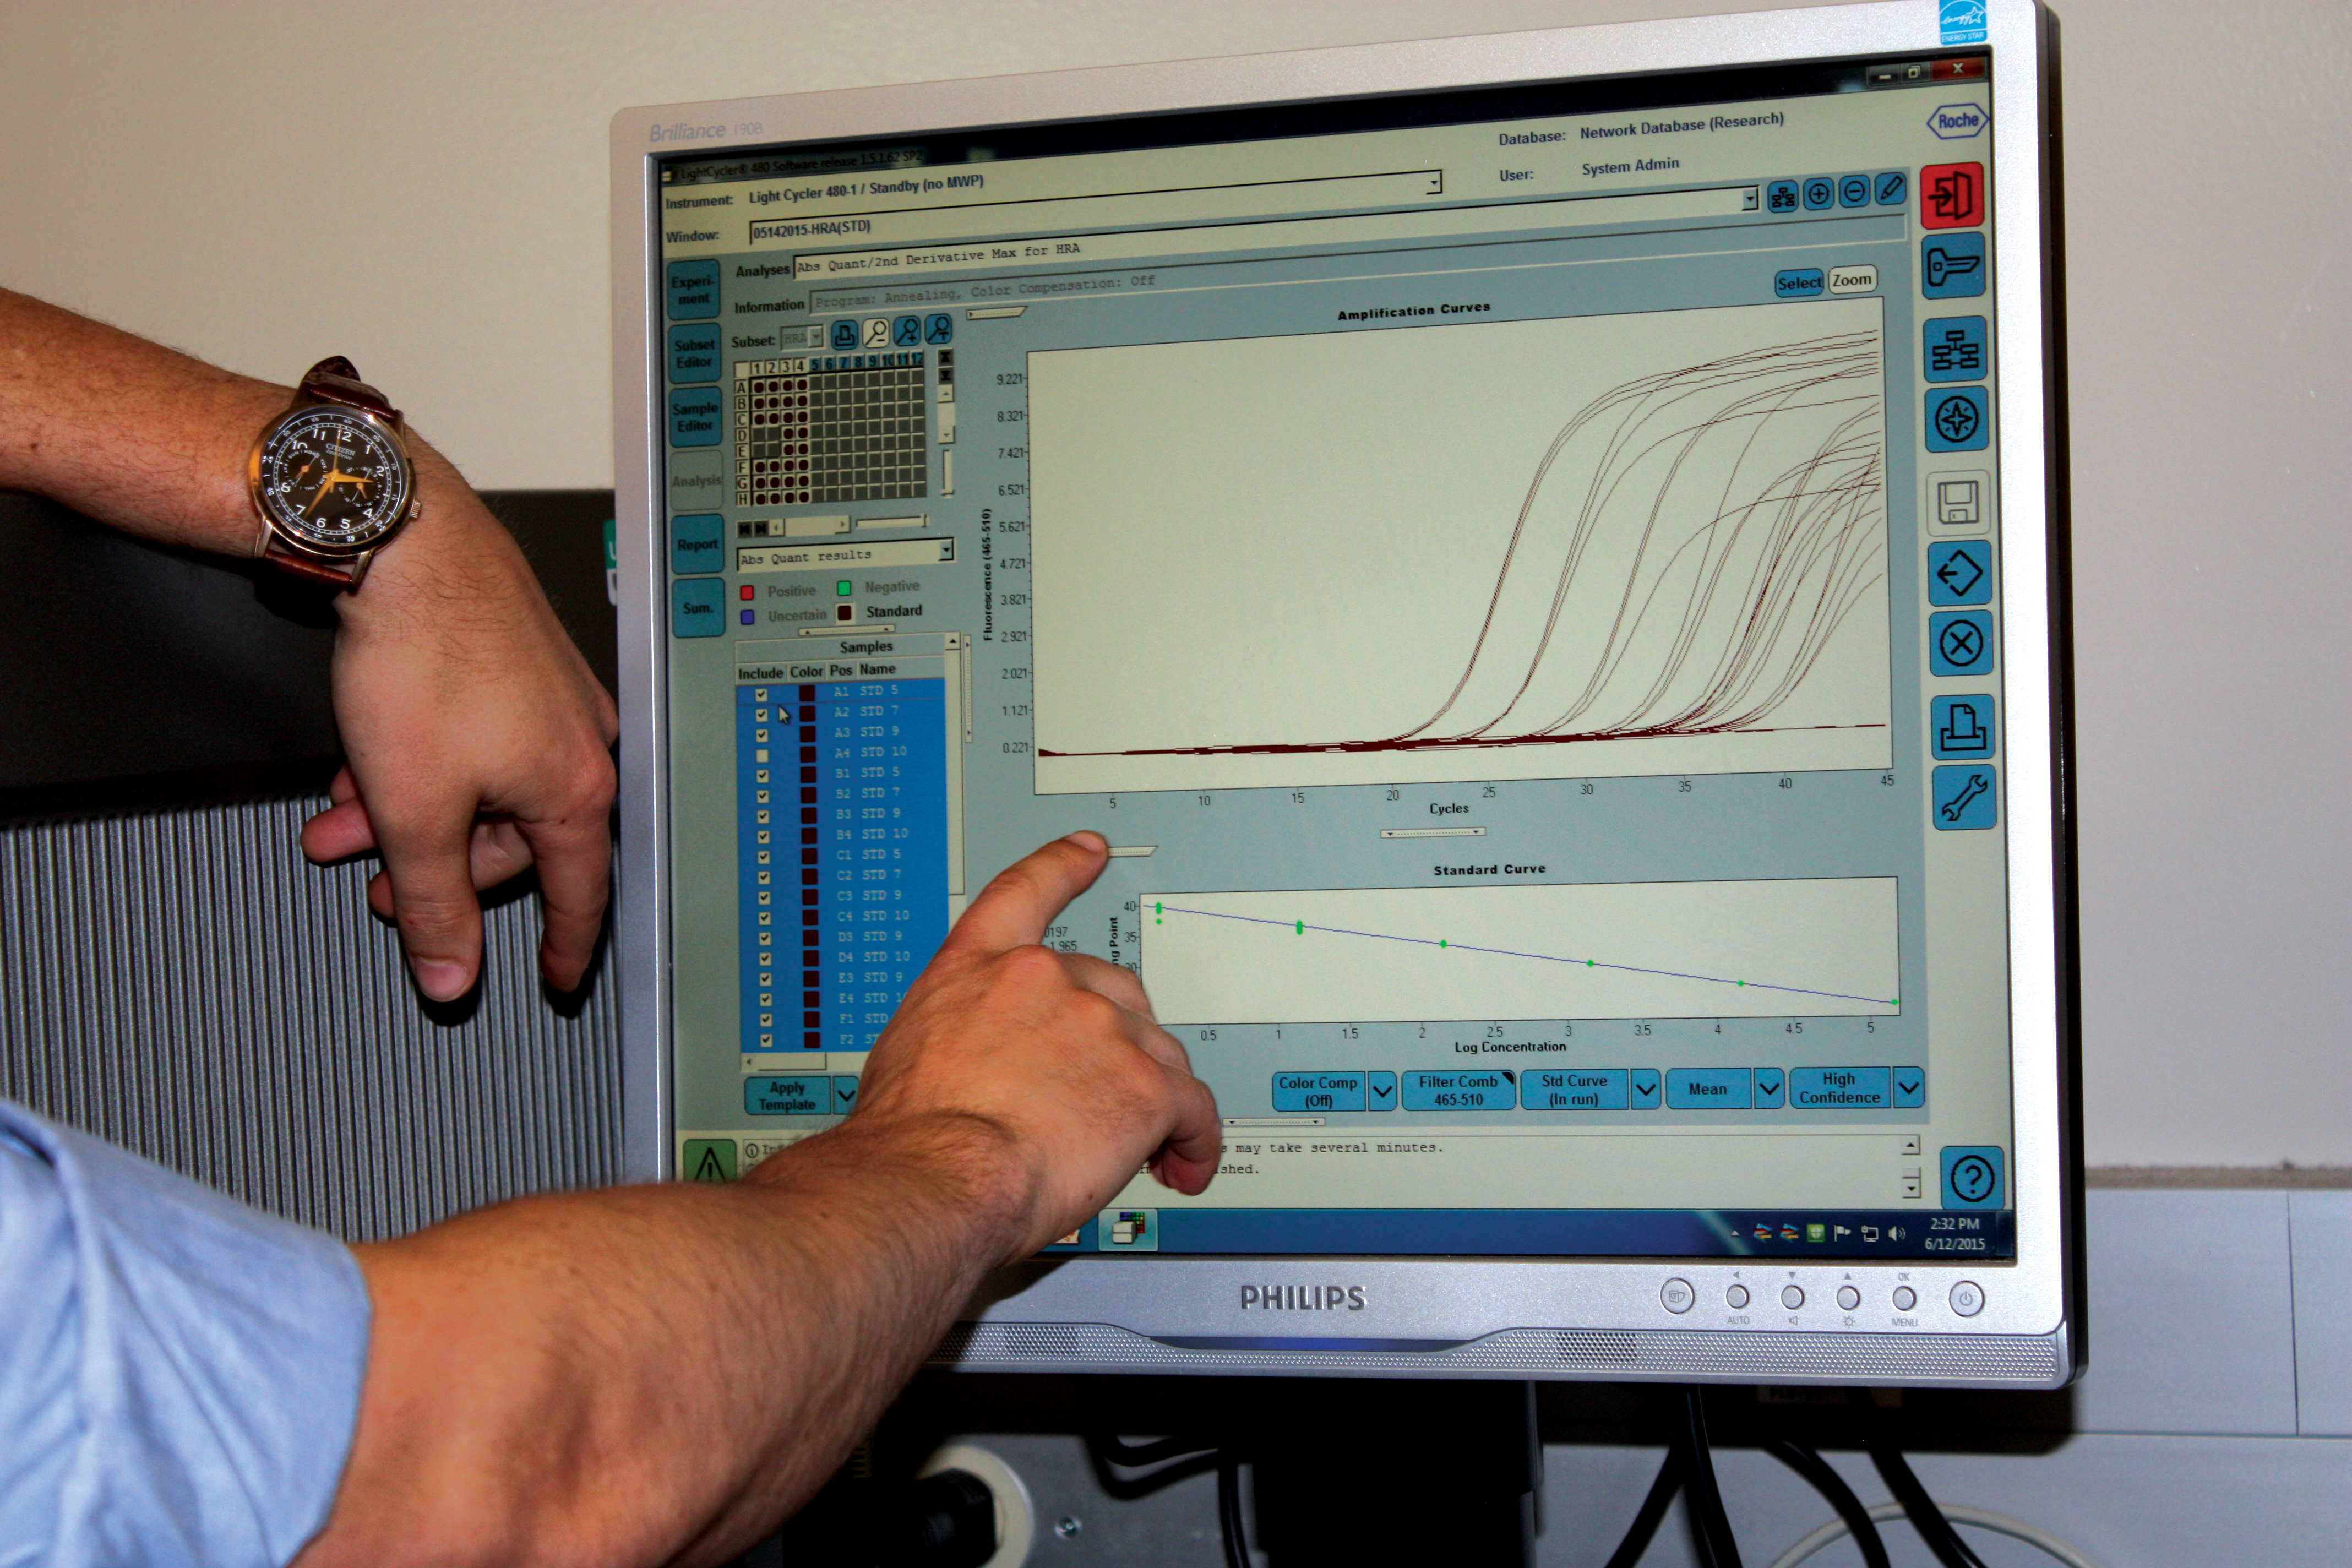
Fluorescence amplification curves from a qPCR analysis

Detailed Description
Example fluorescence amplification curves from a quantitative polymerase chain reaction (qPCR) analysis. By reviewing the fluorescence amplification curves, the concentration of the pathogen in the original sample can be back-calculated from the amount and number of cycles needed to reach the target concentration.
Sources/Usage
Public Domain.