
GFSAD30 Figure D

Detailed Description
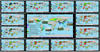
Center image of global cropland (irrigated and rainfed) areas @ 1 km for year 2000 produced by overlying the remote sensing derived product of the International Water Management Institute (IWMI; Thenkabail et al., 2012, 2011, 2009a, 2009b; http://www.iwmigiam.org) over 5 dominant crops (wheat, rice, maize, barley and soybeans) of the world produced by Ramankutty et al. (2008). The 5 crops constitute about 60% of all global cropland areas. The IWMI remote sensing product is derived using remotely sensed data fusion (e.g., NOAA AVHRR, SPOT VGT, JERS SAR), secondary data (e.g., elevation, temperature, and precipitation), and in-situ data. Total area of croplands is 1.53 billion hectares of which 399 million hectares is total area available for irrigation (without considering cropping intensity) and 467 million hectares is annualized irrigated areas (considering cropping intensity). Surrounding NDVI images of irrigated areas: The January to December irrigated area NDVI dynamics is produced using NOAA AVHRR NDVI. The irrigated areas were determined by Thenkabail et al. (2011, 2009a, b).
Sources/Usage
Courtesy: Dr. Prasad Thenkabail
Related

Global Food-and-Water Security-support Analysis Data (GFSAD)
Related