
Graphical representation of the QPPQ methodology, showing A, observed
By Water Resources Mission Area
2010 (approx.)

Detailed Description
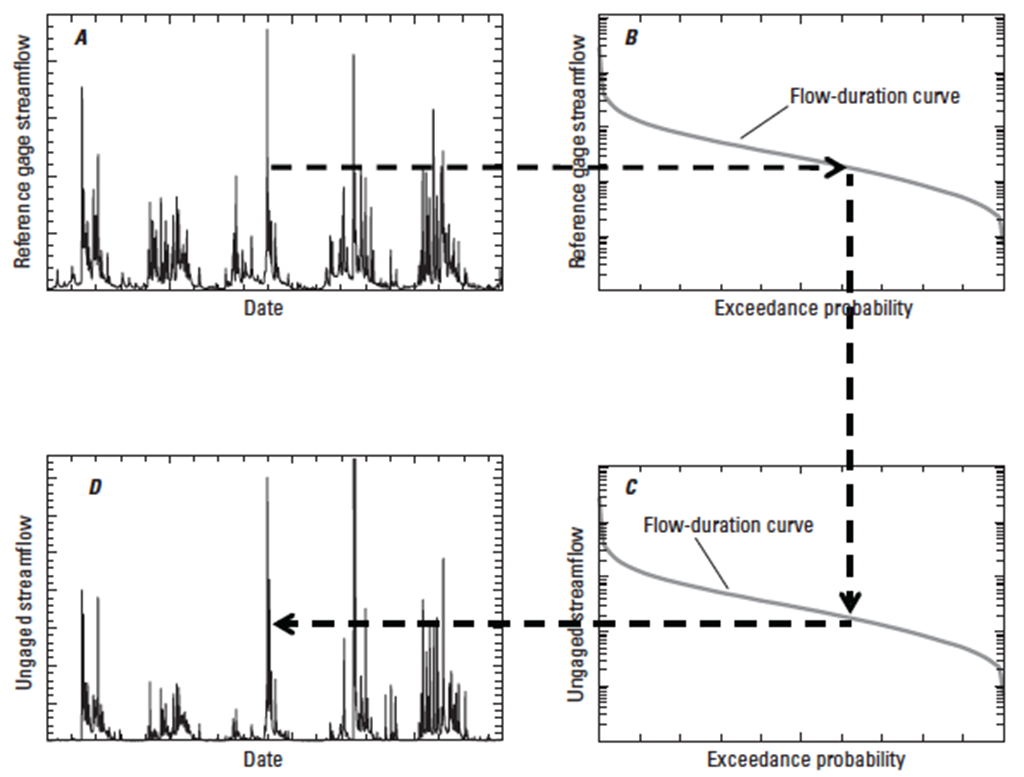
Graphical representation of the QPPQ methodology, showing A, observed daily mean streamflow at a reference streamgage, B, flow-duration curve at the reference streamgage, C, constructed flow-duration curve at the ungaged stream location, and D, estimated daily mean streamflow at the ungaged stream location.
Sources/Usage
Public Domain.
Related

Delaware River Basin Focus Area Study: Statistical Streamflow Modeling
The Delaware River Basin Streamflow Estimator Tool (DRB-SET) uses historical records of streamflow to estimate daily mean streamflow at any stream location within the Delaware River Basin for the period 1960-2010, incorporating basin characteristics such as drainage size, soil, geology, and seasonal precipitation.
Related
Delaware River Basin Focus Area Study: Statistical Streamflow Modeling
The Delaware River Basin Streamflow Estimator Tool (DRB-SET) uses historical records of streamflow to estimate daily mean streamflow at any stream location within the Delaware River Basin for the period 1960-2010, incorporating basin characteristics such as drainage size, soil, geology, and seasonal precipitation.