
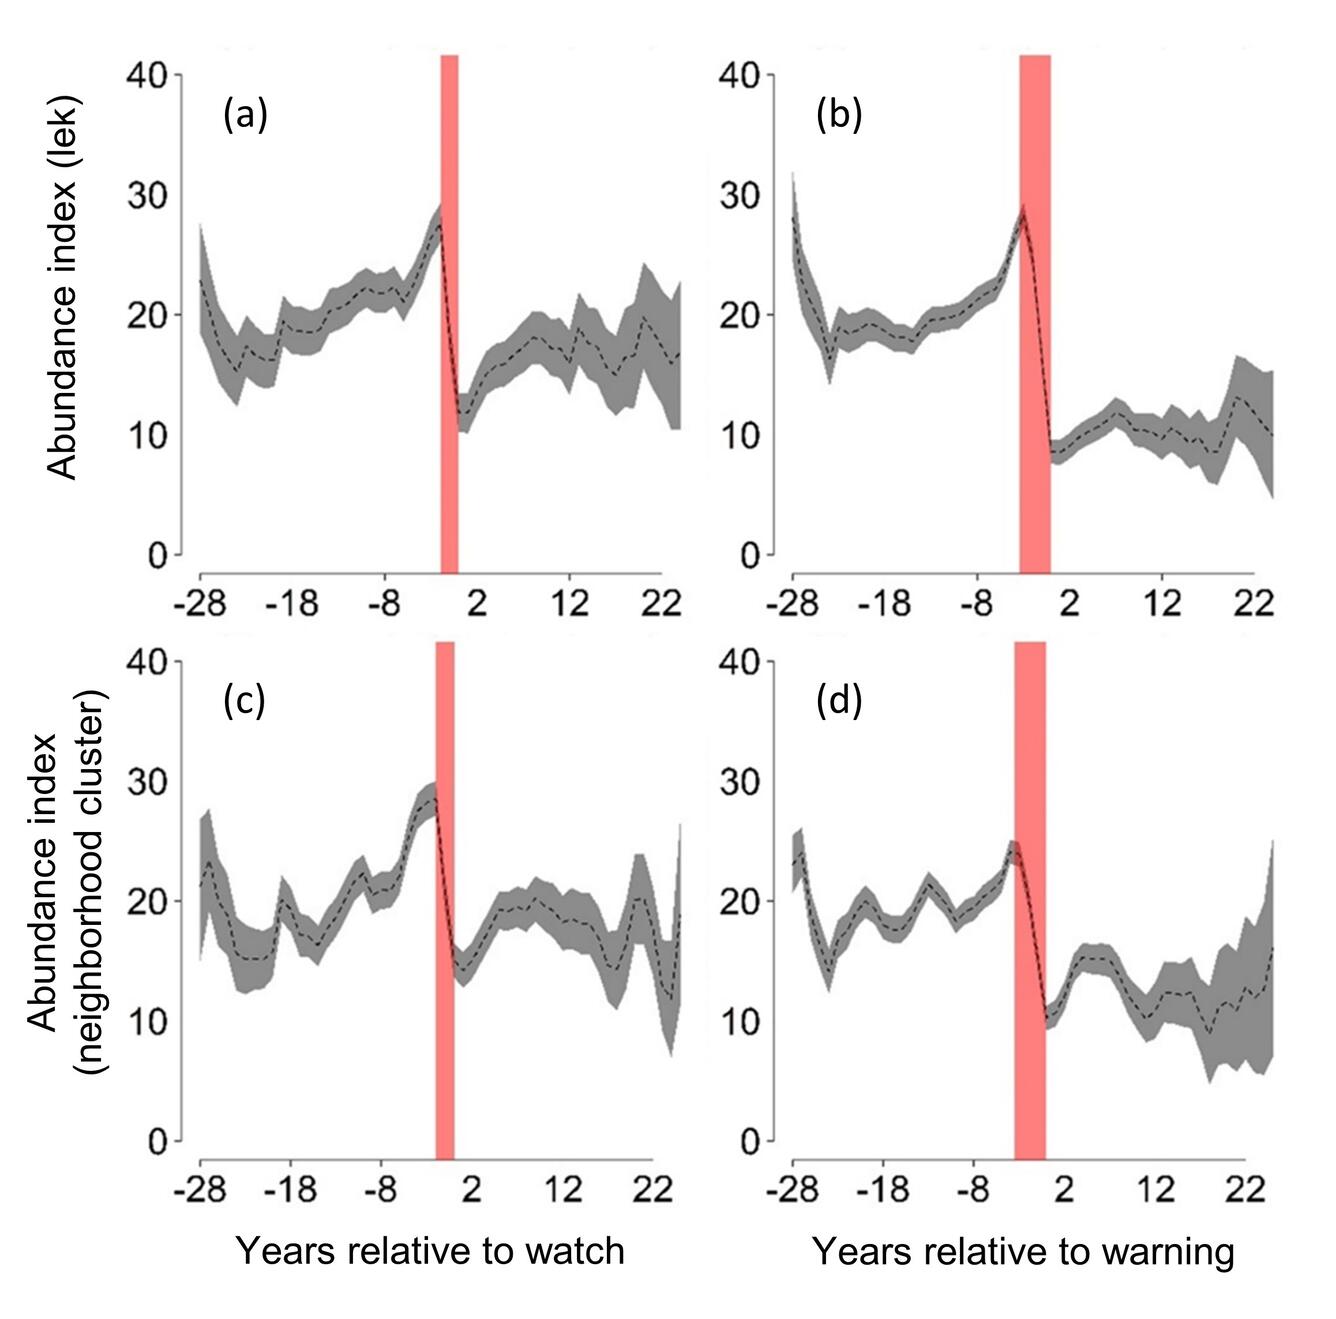
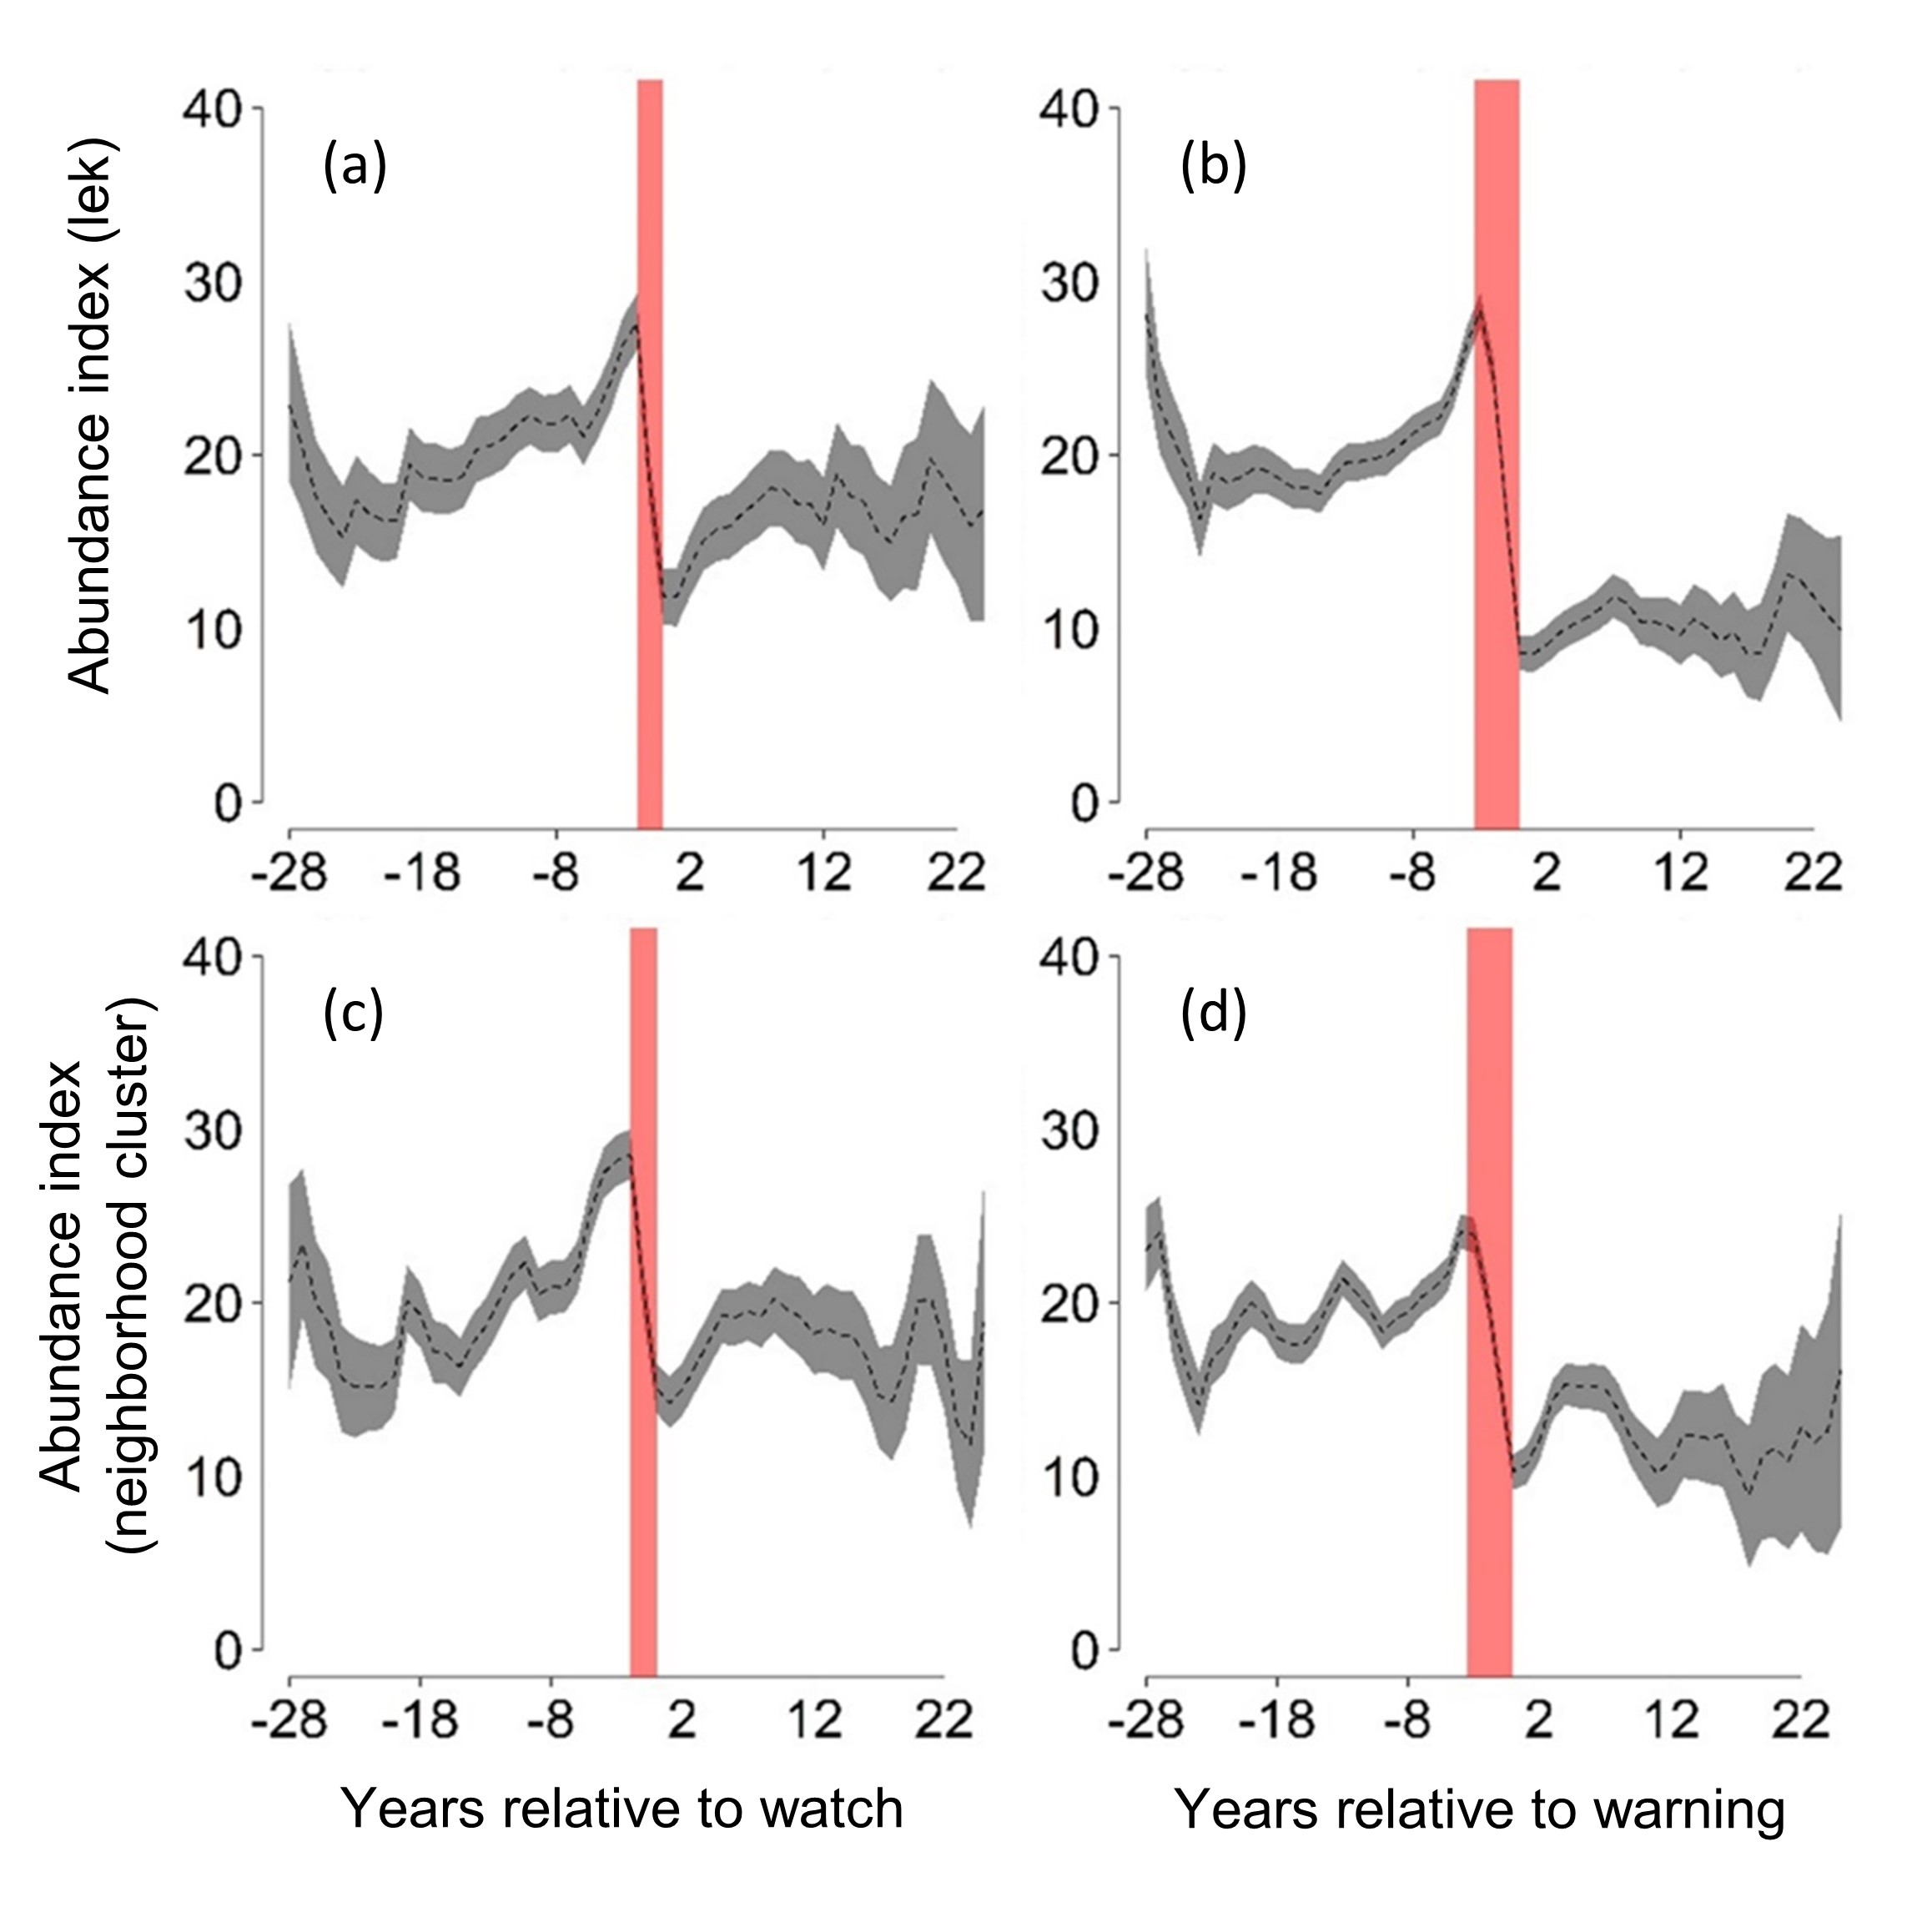
Greater sage-grouse (Centrocercus urophasianus) abundance index (dashed line) relative to scales of management action (lek [breeding site], neighborhood cluster)
By Fort Collins Science Center
January 2024 (approx.)
Detailed Description
Greater sage-grouse (Centrocercus urophasianus) abundance index (dashed line) relative to scales of management action (lek [breeding site], neighborhood cluster). Time represents years before (negative values) or after (positive values) watches (left column) and warnings (right column) occurred. Red polygons represent years during which thresholds were crossed (that is, signal activated), which lead to a watch or warning. Gray areas represent credible intervals of abundance index.
Sources/Usage
Public Domain.
Related

Greater Sage-Grouse Population Monitoring Framework: Targeted Annual Warning System Information Sheet
The Greater Sage-grouse Population Monitoring Framework helps fill a major information gap to aid current assessments of sage-grouse population trends across spatial and temporal scales. It centers on four objectives: 1) create a standardized database of lek counts; 2) cluster leks to develop spatial population structures; 3) estimate spatial trends across temporal extents; and 4) develop a system...

A targeted annual warning system (TAWS) for identifying aberrant declines in greater sage-grouse populations
Land and wildlife managers require accurate estimates of sensitive species’ trends to help guide conservation decisions that maintain biodiversity and promote healthy ecosystems. Multiple science centers with the U.S. Geological Survey (USGS), in conjunction with Colorado State University (CSU), developed a hierarchical population monitoring framework for managing greater sage-grouse (...
Related
Greater Sage-Grouse Population Monitoring Framework: Targeted Annual Warning System Information Sheet
The Greater Sage-grouse Population Monitoring Framework helps fill a major information gap to aid current assessments of sage-grouse population trends across spatial and temporal scales. It centers on four objectives: 1) create a standardized database of lek counts; 2) cluster leks to develop spatial population structures; 3) estimate spatial trends across temporal extents; and 4) develop a system...
A targeted annual warning system (TAWS) for identifying aberrant declines in greater sage-grouse populations
Land and wildlife managers require accurate estimates of sensitive species’ trends to help guide conservation decisions that maintain biodiversity and promote healthy ecosystems. Multiple science centers with the U.S. Geological Survey (USGS), in conjunction with Colorado State University (CSU), developed a hierarchical population monitoring framework for managing greater sage-grouse (...