
Greater Sage-Grouse Population Monitoring Framework: Targeted Annual Warning System Information Sheet
The Greater Sage-grouse Population Monitoring Framework helps fill a major information gap to aid current assessments of sage-grouse population trends across spatial and temporal scales. It centers on four objectives: 1) create a standardized database of lek counts; 2) cluster leks to develop spatial population structures; 3) estimate spatial trends across temporal extents; and 4) develop a system to estimate where and when management action is likely to benefit declining populations of sage-grouse at the appropriate spatial scale on an annual basis.
The framework comprises three lines of evidence to help managers estimate past, present, and future population performance:
1. Trends Analysis – Understanding the Past
The trends analysis provides evidence of past population performance.
2. Targeted Annual Warning System (TAWS) – Tracking the Present
The TAWS provides evidence of present population performance.
3. Extirpation Probabilities – Anticipating the Future
The extirpation probabilities provide evidence of future population performance.
The TAWS is readily usable on an annual basis and can be modified to evaluate the effectiveness of conservation efforts. The TAWS identifies when a population or lek is declining, and when the local decline is decoupled from the larger regional trend (Figure 1). This signal allows managers to distinguish regional declines caused by large-scale factors (i.e., climate) from local declines caused by disturbances that may be improved with targeted management intervention. The severity of the signal is defined by one of two categories, ‘watches’ and ‘warnings’, and helps inform what level of management may be warranted. Watches may indicate the need for additional monitoring, whereas warnings may indicate the need for management intervention to stabilize populations. The TAWS can also be used for adaptive management by tracking changes in population signals following some management action. Collectively, these rules facilitate detection of population declines that are distinguished from the adverse impacts associated with wider-reaching environmental stochasticity.
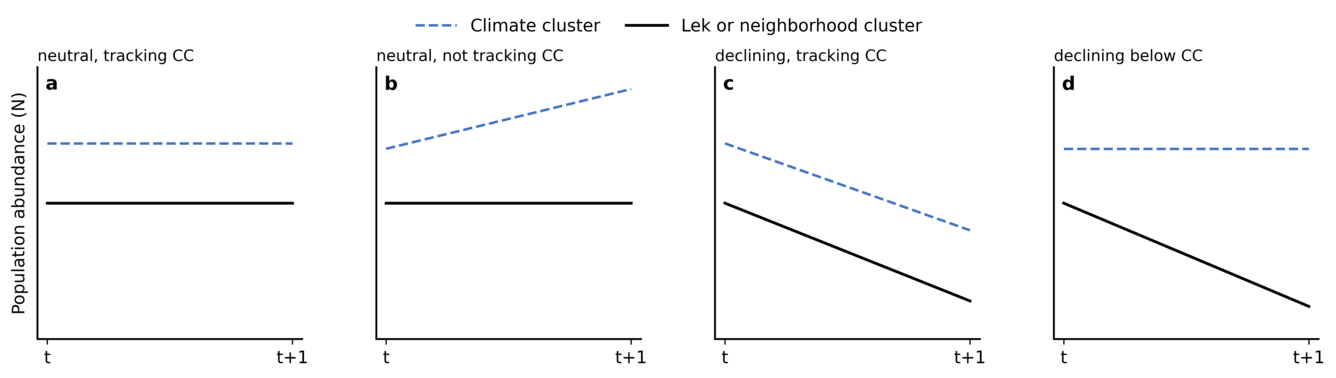
USGS researchers used 30+ continuous years (1990–Present) of annual range-wide lek count data, provided by state wildlife agencies, to identify populations exhibiting the greatest need for management intervention. They achieved this objective by contrasting population change rates at management scales (i.e., lek or Neighborhood Cluster) with those at broader scales (i.e., Climate Cluster). The Climate Cluster-scale captures regional environmental conditions (Figure 1). Lek and Neighborhood Cluster scales capture environmental conditions and local disturbances, ranging in size from point sources such as infrastructure development to large wildfires. The TAWS identifies when population (i.e., lek or Neighborhood Cluster) declines may be amenable to management actions. A population that is tracking the larger Climate Cluster (Figure 1a, 1c) may not respond to management because the evidence available suggests that the trend is a function of abiotic factors rather than local disturbance(s), even when the population is declining (Figure 1c). Additionally, a population that is stable or growing, even at a slower rate than the Climate Cluster, may not be the best allocation of management resources (Figure 1b). If a lek or Neighborhood Cluster declines faster than the Climate Cluster, this indicates local factors that increase pressure on the population, which may be mitigated by targeted management actions (Figure 1d).
The TAWS assigns signals to populations that show evidence of decline due to local disturbances. These signals are based on 1) the rate of the decline and 2) the duration of the decline. Including the second criteria safeguards against prematurely indicating a signal due to a single year of poor demographic performance or errors in lek counts. USGS researchers developed two categories for multi-year signaling events referred to as ‘watches’ and ‘warnings.’ Because rates of decline at levels below the Climate Cluster can occur gradually or precipitously, USGS researchers developed separate thresholds for each scenario: (1) a slow threshold, which identified leks (or Neighborhood Clusters) likely to experience a gradual decline with estimates below the Climate Cluster and (2) a fast threshold, which focused on leks (or Neighborhood Clusters) with relatively high likelihood of near-term extirpation from a precipitous decline also with estimates below the Climate Cluster (Figure 2). They assigned watches to populations that had slow signals over 2 consecutive years. They assigned warnings to populations that had slow signals in 3 out of 4 consecutive years or fast signals in 2 out of 3 consecutive years.

A substantial challenge in estimating annual rates of population change for sage-grouse leks and Neighborhood Clusters is that many populations have incomplete time series of count data. To overcome this obstacle, USGS researchers implemented a modeling approach that enabled information to be shared across aggregations of spatially structured populations. The Climate Cluster rate of population change was informed by the population change rates estimated across all Neighborhood Clusters within the Climate Cluster boundary. Similarly, the Neighborhood Cluster rate of population change was informed by the population change rates estimated across all leks within the Neighborhood Cluster boundary. Estimates of population change, at the lek-level, were generated for years of missing data by sampling from probability distributions that were based on (1) the hierarchically nested spatial relationships defined by the population clusters and (2) the within population variability in rate of change parameters estimated from the available data. Most importantly, when data were unavailable, the rate of population change at the lek or Neighborhood Cluster moved toward the center of the normal distribution. From the TAWS’s perspective, there was little discernible difference between the lek or Neighborhood Cluster rate of population change and the Climate Cluster scale rate of population change. Therefore, there was an inability to produce a signal. From a practical perspective, there was a lack of information to make a management decision and therefore a limitation to doing so.
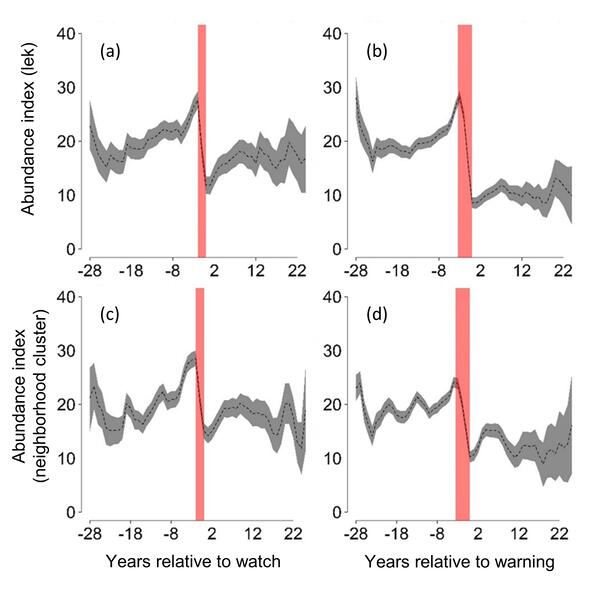
The TAWS framework was applied to >4,400 leks distributed across the western United States, with population change estimates spanning more than 30 years (1990–Present). Results revealed population declines of 58–67% immediately preceding signals (2–4-year period). Population trends unassociated with signals showed little to no evidence of decline. Furthermore, we found that an average annual rate of 1.7% of leks, or 1.3% of Neighborhood Clusters (lek aggregations), would have required management intervention to reverse range-wide declines and stabilize the entire sage-grouse range.
Co-production
We continue working with all collaborators to improve sage-grouse management tools. Each year, an updated version of a range-wide standardized lek count database is developed to include new counts and historical corrections (e.g., transfer of paper records to digital files) with improvements to data quality using rigorous quality control (quality assurance) methods. These data are incorporated into the TAWS framework to produce results that are delivered in time for annual agency decision making.
Data restrictions
State wildlife agencies collect and manage lek databases. Because sage-grouse are a species of conservation concern and sensitive to activities during breeding, these data are available only after acquiring formal data-sharing agreements with individual states.
Funders
U.S. Geological Survey (Ecosystems Mission Area, Land Management Research Program and Species Management Research Program, Wyoming Landscape Conservation Initiative) and U.S. Bureau of Land Management.
Partners
State Wildlife Agencies (California Department of Fish and Wildlife; Colorado Parks and Wildlife; Idaho Department of Fish and Game; Montana Fish, Wildlife & Parks; Nevada Department of Wildlife; North Dakota Game and Fish Department; Oregon Department of Fish and Wildlife; South Dakota Department of Game, Fish and Parks; Utah Division of Wildlife Resources; Wyoming Game and Fish Department; Washington Department of Fish and Wildlife), Colorado State University, BLM, US Fish and Wildlife Service, US Forest Service, researchers who provided field data to evaluate results.

Greater Sage-Grouse Population Monitoring Framework

A targeted annual warning system (TAWS) for identifying aberrant declines in greater sage-grouse populations

Estimating trends for greater sage-grouse populations within highly stochastic environments

Hierarchical Units of Greater Sage-Grouse Populations Informing Wildlife Management
The Greater Sage-grouse Population Monitoring Framework helps fill a major information gap to aid current assessments of sage-grouse population trends across spatial and temporal scales. It centers on four objectives: 1) create a standardized database of lek counts; 2) cluster leks to develop spatial population structures; 3) estimate spatial trends across temporal extents; and 4) develop a system to estimate where and when management action is likely to benefit declining populations of sage-grouse at the appropriate spatial scale on an annual basis.
The framework comprises three lines of evidence to help managers estimate past, present, and future population performance:
1. Trends Analysis – Understanding the Past
The trends analysis provides evidence of past population performance.
2. Targeted Annual Warning System (TAWS) – Tracking the Present
The TAWS provides evidence of present population performance.
3. Extirpation Probabilities – Anticipating the Future
The extirpation probabilities provide evidence of future population performance.
The TAWS is readily usable on an annual basis and can be modified to evaluate the effectiveness of conservation efforts. The TAWS identifies when a population or lek is declining, and when the local decline is decoupled from the larger regional trend (Figure 1). This signal allows managers to distinguish regional declines caused by large-scale factors (i.e., climate) from local declines caused by disturbances that may be improved with targeted management intervention. The severity of the signal is defined by one of two categories, ‘watches’ and ‘warnings’, and helps inform what level of management may be warranted. Watches may indicate the need for additional monitoring, whereas warnings may indicate the need for management intervention to stabilize populations. The TAWS can also be used for adaptive management by tracking changes in population signals following some management action. Collectively, these rules facilitate detection of population declines that are distinguished from the adverse impacts associated with wider-reaching environmental stochasticity.
USGS researchers used 30+ continuous years (1990–Present) of annual range-wide lek count data, provided by state wildlife agencies, to identify populations exhibiting the greatest need for management intervention. They achieved this objective by contrasting population change rates at management scales (i.e., lek or Neighborhood Cluster) with those at broader scales (i.e., Climate Cluster). The Climate Cluster-scale captures regional environmental conditions (Figure 1). Lek and Neighborhood Cluster scales capture environmental conditions and local disturbances, ranging in size from point sources such as infrastructure development to large wildfires. The TAWS identifies when population (i.e., lek or Neighborhood Cluster) declines may be amenable to management actions. A population that is tracking the larger Climate Cluster (Figure 1a, 1c) may not respond to management because the evidence available suggests that the trend is a function of abiotic factors rather than local disturbance(s), even when the population is declining (Figure 1c). Additionally, a population that is stable or growing, even at a slower rate than the Climate Cluster, may not be the best allocation of management resources (Figure 1b). If a lek or Neighborhood Cluster declines faster than the Climate Cluster, this indicates local factors that increase pressure on the population, which may be mitigated by targeted management actions (Figure 1d).
The TAWS assigns signals to populations that show evidence of decline due to local disturbances. These signals are based on 1) the rate of the decline and 2) the duration of the decline. Including the second criteria safeguards against prematurely indicating a signal due to a single year of poor demographic performance or errors in lek counts. USGS researchers developed two categories for multi-year signaling events referred to as ‘watches’ and ‘warnings.’ Because rates of decline at levels below the Climate Cluster can occur gradually or precipitously, USGS researchers developed separate thresholds for each scenario: (1) a slow threshold, which identified leks (or Neighborhood Clusters) likely to experience a gradual decline with estimates below the Climate Cluster and (2) a fast threshold, which focused on leks (or Neighborhood Clusters) with relatively high likelihood of near-term extirpation from a precipitous decline also with estimates below the Climate Cluster (Figure 2). They assigned watches to populations that had slow signals over 2 consecutive years. They assigned warnings to populations that had slow signals in 3 out of 4 consecutive years or fast signals in 2 out of 3 consecutive years.
A substantial challenge in estimating annual rates of population change for sage-grouse leks and Neighborhood Clusters is that many populations have incomplete time series of count data. To overcome this obstacle, USGS researchers implemented a modeling approach that enabled information to be shared across aggregations of spatially structured populations. The Climate Cluster rate of population change was informed by the population change rates estimated across all Neighborhood Clusters within the Climate Cluster boundary. Similarly, the Neighborhood Cluster rate of population change was informed by the population change rates estimated across all leks within the Neighborhood Cluster boundary. Estimates of population change, at the lek-level, were generated for years of missing data by sampling from probability distributions that were based on (1) the hierarchically nested spatial relationships defined by the population clusters and (2) the within population variability in rate of change parameters estimated from the available data. Most importantly, when data were unavailable, the rate of population change at the lek or Neighborhood Cluster moved toward the center of the normal distribution. From the TAWS’s perspective, there was little discernible difference between the lek or Neighborhood Cluster rate of population change and the Climate Cluster scale rate of population change. Therefore, there was an inability to produce a signal. From a practical perspective, there was a lack of information to make a management decision and therefore a limitation to doing so.
The TAWS framework was applied to >4,400 leks distributed across the western United States, with population change estimates spanning more than 30 years (1990–Present). Results revealed population declines of 58–67% immediately preceding signals (2–4-year period). Population trends unassociated with signals showed little to no evidence of decline. Furthermore, we found that an average annual rate of 1.7% of leks, or 1.3% of Neighborhood Clusters (lek aggregations), would have required management intervention to reverse range-wide declines and stabilize the entire sage-grouse range.
Co-production
We continue working with all collaborators to improve sage-grouse management tools. Each year, an updated version of a range-wide standardized lek count database is developed to include new counts and historical corrections (e.g., transfer of paper records to digital files) with improvements to data quality using rigorous quality control (quality assurance) methods. These data are incorporated into the TAWS framework to produce results that are delivered in time for annual agency decision making.
Data restrictions
State wildlife agencies collect and manage lek databases. Because sage-grouse are a species of conservation concern and sensitive to activities during breeding, these data are available only after acquiring formal data-sharing agreements with individual states.
Funders
U.S. Geological Survey (Ecosystems Mission Area, Land Management Research Program and Species Management Research Program, Wyoming Landscape Conservation Initiative) and U.S. Bureau of Land Management.
Partners
State Wildlife Agencies (California Department of Fish and Wildlife; Colorado Parks and Wildlife; Idaho Department of Fish and Game; Montana Fish, Wildlife & Parks; Nevada Department of Wildlife; North Dakota Game and Fish Department; Oregon Department of Fish and Wildlife; South Dakota Department of Game, Fish and Parks; Utah Division of Wildlife Resources; Wyoming Game and Fish Department; Washington Department of Fish and Wildlife), Colorado State University, BLM, US Fish and Wildlife Service, US Forest Service, researchers who provided field data to evaluate results.
Greater Sage-Grouse Population Monitoring Framework
A targeted annual warning system (TAWS) for identifying aberrant declines in greater sage-grouse populations
Estimating trends for greater sage-grouse populations within highly stochastic environments