
How are lava-flow maps made during an eruption?
Detailed Description
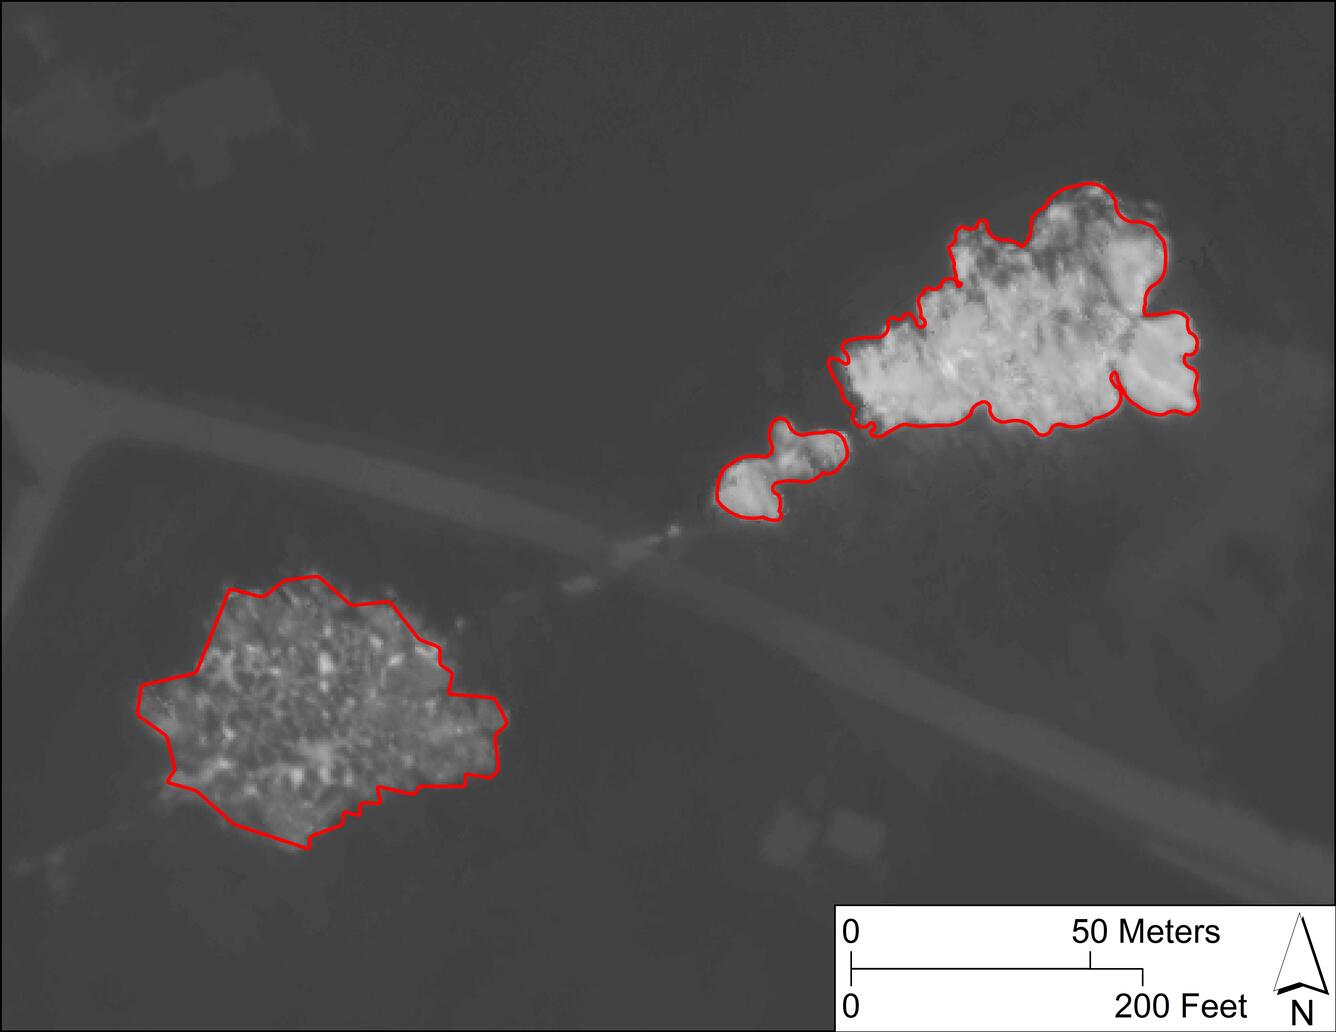
Bright red polygon features were drawn by USGS Geographic Information Systems (GIS) analysts around new or active lower East Rift Zone lava flows, which appear lighter in color due to their high temperature on this thermal map. Collected during a helicopter overflight on May 9, 2018, this map shows fissures 6 (left) and 15 (right) with Pohoiki Road passing between the two vents. USGS map.
Sources/Usage
Public Domain.