
How Often Will Maui’s Soils Run Dry? Projected Impacts of Drought, Climate, and Land Use

Detailed Description
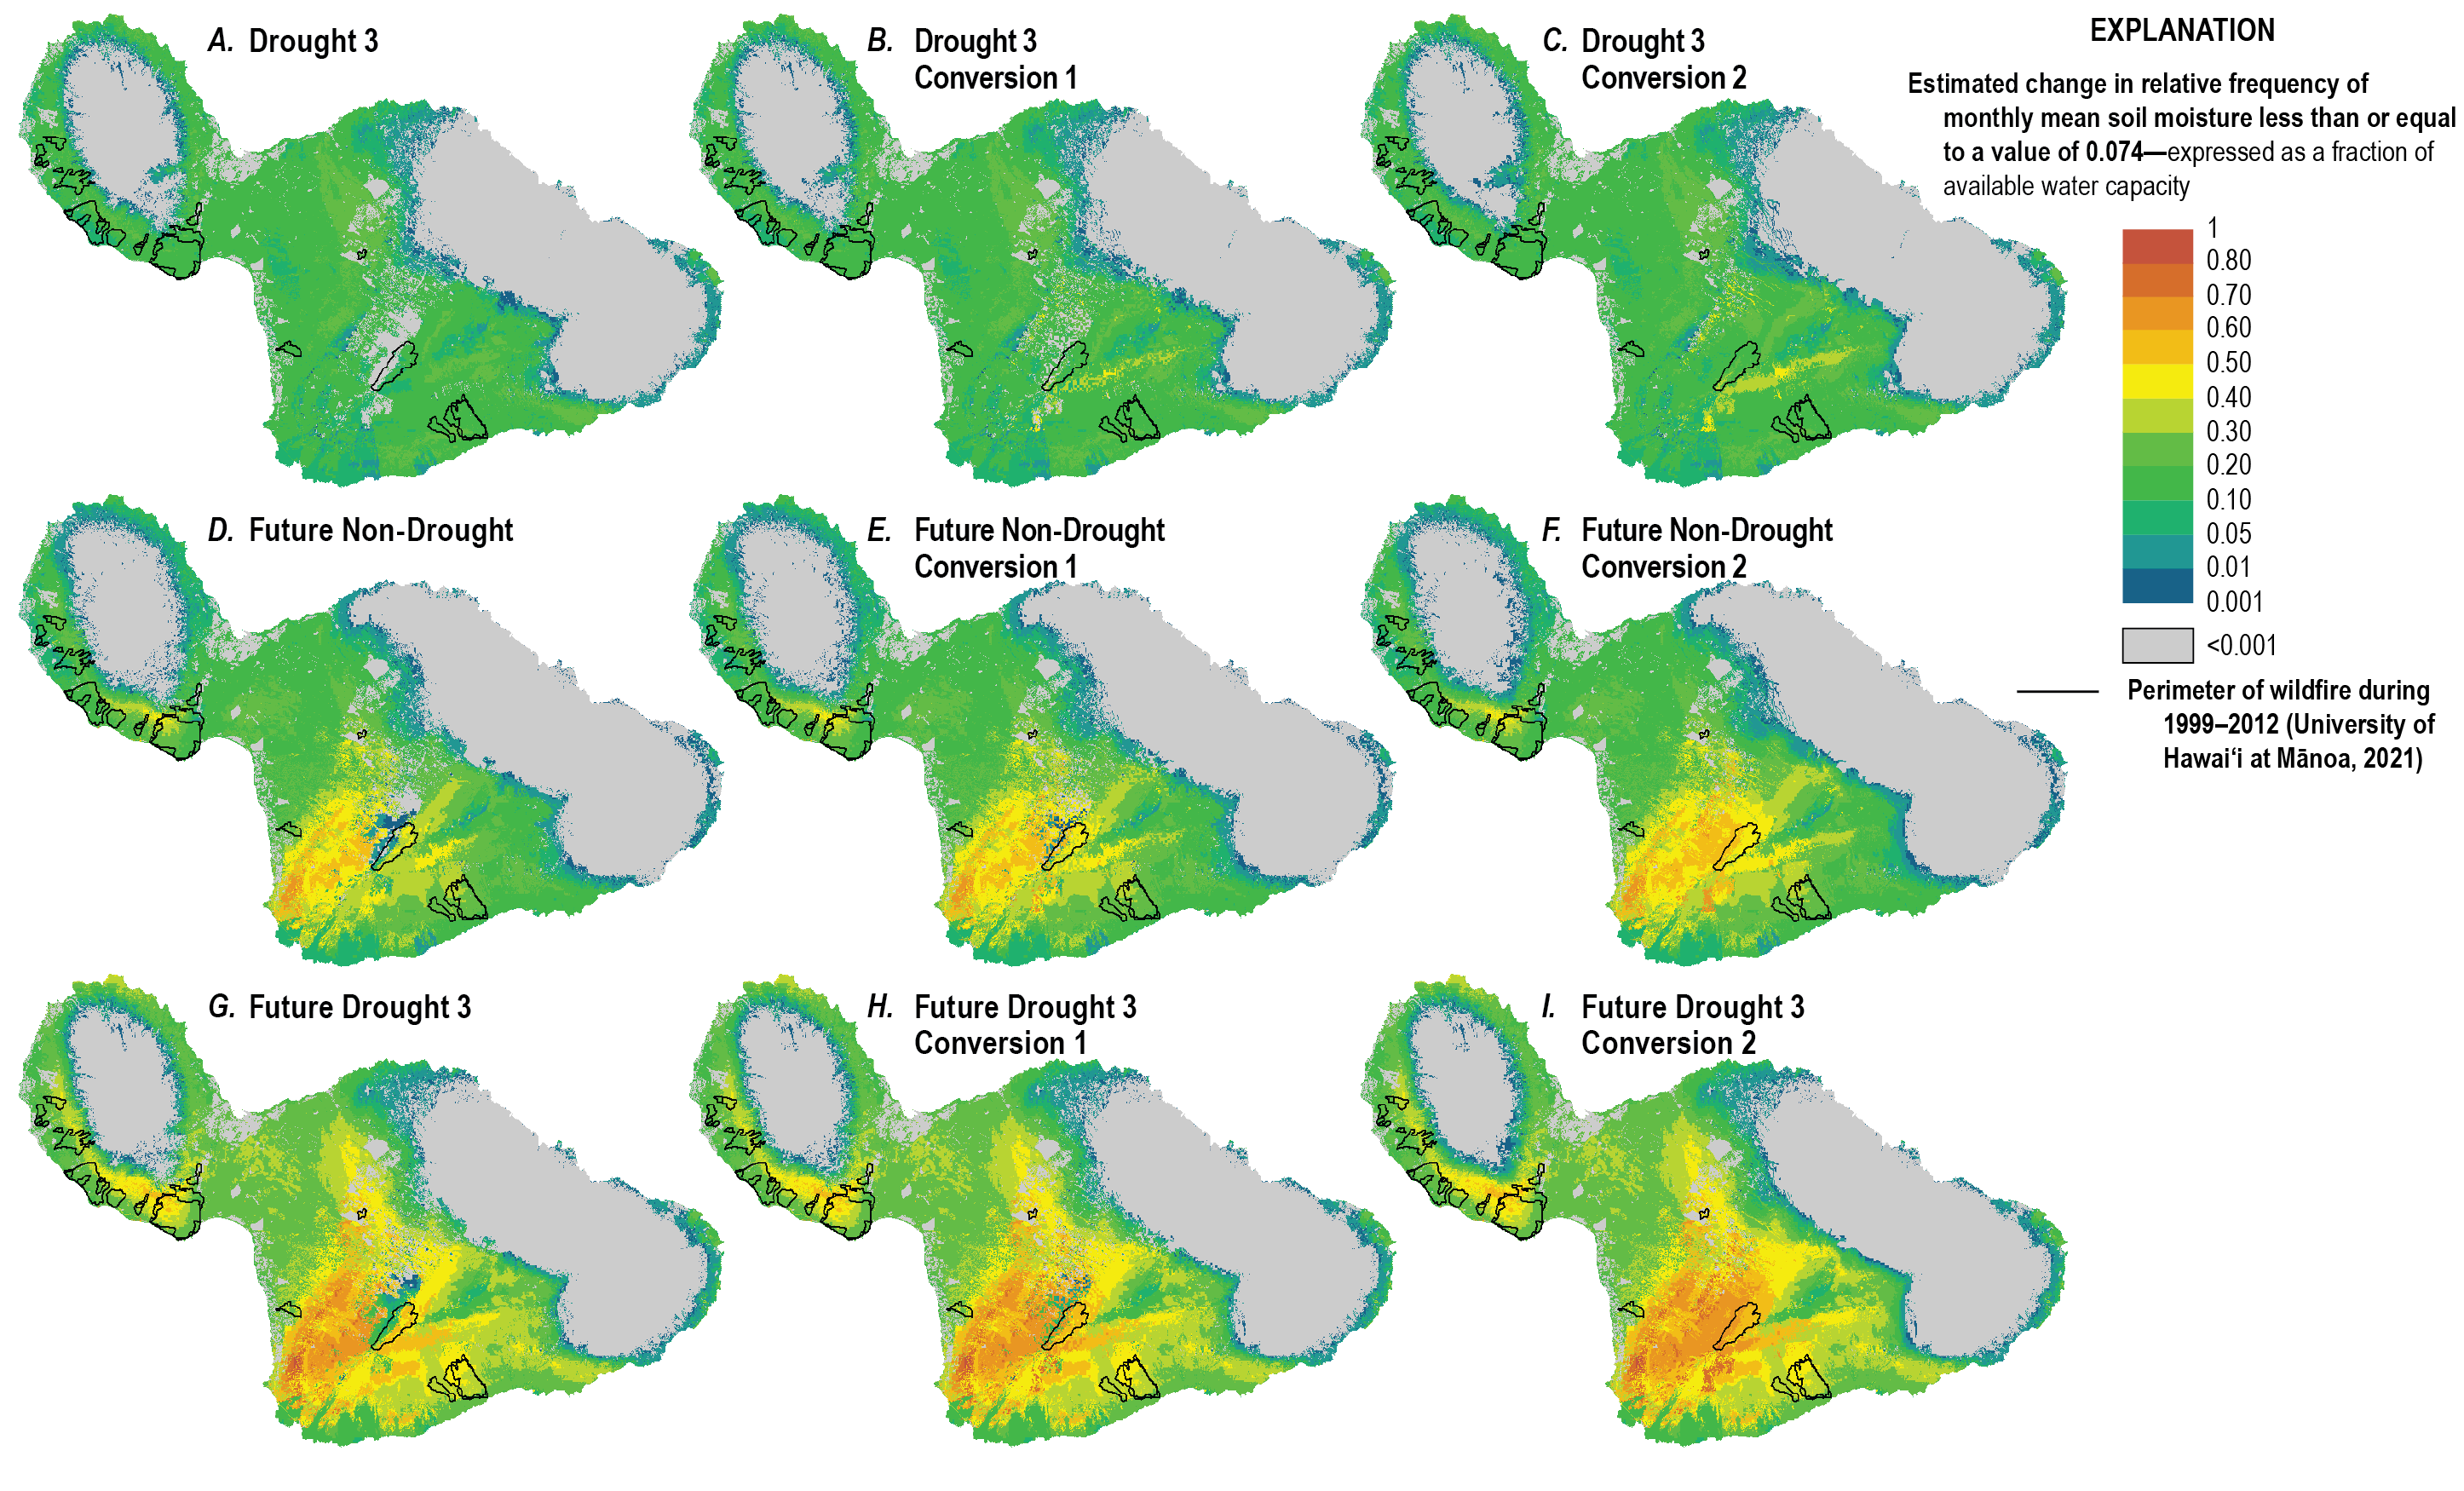
Maps showing estimated increases in relative frequency of monthly mean soil moisture less than or equal to a value of 0.074 for nine water-budget scenarios for Maui. A, Drought 3 scenario. B, Drought 3 Conversion 1 scenario. C, Drought 3 Conversion 2 scenario. D, Future Non-Drought scenario. E, Future Non-Drought Conversion 1 scenario. F, Future Non-Drought Conversion 2 scenario. G, Future Drought 3 scenario. H, Future Drought 3 Conversion 1 scenario. I, Future Drought 3 Conversion 2 scenario. All increases in relative frequency are relative to a Non-Drought scenario, which consists of rainfall during 1990–97 and 2003–06 from Frazier and others (2016), and 2020 land cover from Kāne and others (2024a). Drought 3 rainfall is rainfall during 1998–2002 and 2007–12 from Frazier and others (2016), Future Non-Drought rainfall is rainfall during 1990–97 and 2003–06 from Frazier and others (2016) adjusted for a Representative Concentration Pathway (RCP) 8.5 2071–99 projection from Elison Timm and others (2015), and Future Drought 3 rainfall is rainfall during 1998–2002 and 2007–12 from Frazier and others (2016) adjusted for a RCP8.5 2071–99 projection from Elison Timm and others (2015). Conversion 1 land cover is land-cover condition in which roughly 50 percent of shrubland and forest areas within the cloud zone are converted to grassland. Conversion 2 land cover is land-cover condition in which 100 percent of shrubland and forest areas within the cloud zone are converted to grassland.
Sources/Usage
Public Domain.
Related

Effects of Drought and Cloud-Water Interception on Wildfire Hazard in Hawaiʻi
Related