
Long-term correlations between sea-surface salinity and rainfall

Detailed Description
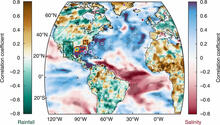
Long-term correlations between observed sea-surface salinity and rainfall. Correlation map between northern Gulf of America sea-surface salinity (SSS; dashed red box) and global oceanic SSS (ORA-S4 data set; red-blue scale), as well as continental precipitation (GPCC data set; brown-green scale) with locations of proxy records used in the study. Proxy locations are marked with circles (sedimentary records), triangles (speleothems), dashed boxes (tree-ring compilations), stars (circulation proxies), and squares (additional proxies) with color fill indicating sign (fresh – blue; dry/wet–brown/green; purple–weakened poleward transport) during the Little Ice Age (1450–1850 C. E.). Figure from: Thirumalai and others, 2018.
Sources/Usage
Published Open Access by Springer in Nature Communications. Limited Use by USGS only.
Related

Paleoclimate Reconstruction from Marine and Lake Sediments
Related