
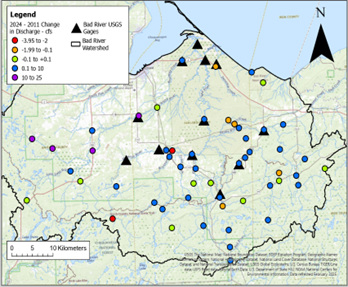
Map showing location where the USGS monitors streamflow and velocity in the Mashkiiziibii watershed
By Upper Midwest Water Science Center
September 2024 (approx.)
Detailed Description
This map shows the location where the USGS monitors streamflow and velocity in the Mashkiiziibii watershed. In the Fall of 2024, a seepage run was conducted to track the amount of baseflow in tributaries across the watershed (flows between rain events). Many of the streams had more flow in 2024 (blue and purple dots) compared to previous study in 2011. Data are publicly available on USGS websites.
Sources/Usage
Public Domain.
Related

Bad River Watershed Assessments
The Bad River has one of the highest sediment loads of all Lake Superior tributaries and is an important resource for lake sturgeon and the Bad River Tribe. This study monitors the effects of streamflow variability on sediment-related problems, including understanding the influence of land cover on hydrology, habitat, erosion and sedimentation rates, and water quality of the Bad River.
Related
Bad River Watershed Assessments
The Bad River has one of the highest sediment loads of all Lake Superior tributaries and is an important resource for lake sturgeon and the Bad River Tribe. This study monitors the effects of streamflow variability on sediment-related problems, including understanding the influence of land cover on hydrology, habitat, erosion and sedimentation rates, and water quality of the Bad River.