
The Bad River has one of the highest sediment loads of all Lake Superior tributaries and is an important resource for lake sturgeon and the Bad River Tribe. This study monitors the effects of streamflow variability on sediment-related problems, including understanding the influence of land cover on hydrology, habitat, erosion and sedimentation rates, and water quality of the Bad River.

Overview
The USGS has partnered with the Mashkiiziibii Natural Resources Department (MNRD) for over 20 years on science support and monitoring related to floods, water quality assessments, geomorphic change, groundwater and groundwater/surface water interactions, oil spill planning, and mercury studies in the Bad River (Mashkiiziibii) Watershed. Our studies have direct guidance and critical collaboration by MNRD staff.
In 2025 we began a two-year study funded by the Great Lakes Restoration Initiative to integrate available hydrologic and geomorphic data and studies to create insightful linkages among groundwater/surface water interactions, floods, erosion and deposition, and eventually water quality. This diagram illustrates some of the major pathways that water in the Mashkiiziibii takes during its journey from the sky and ground sources to Lake Superior.
Problem
A historical perspective of changes in the sediment, water quality, and hydrologic conditions of the Bad River watershed is needed for environmental management and protection of the Bad River Tribe’s water resources. Previous sediment load studies conducted by the USGS identified the Bad River as having the highest sediment load of all tributaries to Lake Superior. A large, highly valued coastal wetland complex in the Kakagon and Bad River Sloughs exists at the mouth of the river and is affected by flooding and sedimentation from the Bad River. The Bad River is one of a handful of rivers that has naturally reproducing lake sturgeon.

Objectives
The objectives of the studies included in this project are varied but have a central thread of long-term monitoring of changes in streamflow and groundwater related to land use changes and meteorological variations. The main objectives of this study are to understand the historical and modern influences of land cover on hydrology, habitat, erosion/sedimentation rates, and water quality of the Bad River and its key tributaries.
Approach
All aspects of the approach are coordinated and assisted by scientists, managers, and technicians in the Mashkiiziibii Natural Resources Department. The approach began with a GIS analysis of the watershed and identification of erosion and sedimentation hotspots. Valley cross sections were surveyed and floodplain stratigraphy was used to establish historical overbank sedimentation rates. Streamflow and water quality characteristics were monitored in relation to nutrient sources, potential mining, and oil spill preparedness. Groundwater flow models were completed. Flood studies were completed after the 2016 floods. Various studies conducted by the USGS in the Bad River watershed are summarized below.
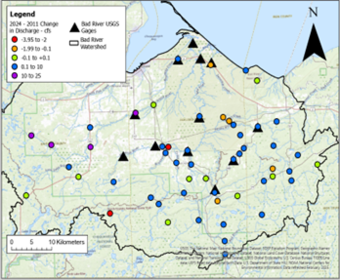
Streamflow monitoring and synoptic surveys
This map shows the location where the USGS monitors streamflow and velocity in the Mashkiiziibii watershed. In the Fall of 2024, a seepage run was conducted to track the amount of baseflow in tributaries across the watershed (flows between rain events). Many of the streams had more flow in 2024 (blue and purple dots) compared to previous study in 2011. Data are publicly available on USGS websites.
Flood studies and inundation maps
Documenting the extent of flooding is important to know relative to precipitation, human safety, and damages to infrastructure and property. MNRD staff were instrumental at documenting the high-water marks, which could be surveyed in later by USGS crews and helped determine flood inundation maps for the Bad River, Beartrap Creek, and Denomie Creek. These maps can then be used to help predict future floods with varying rainfall.
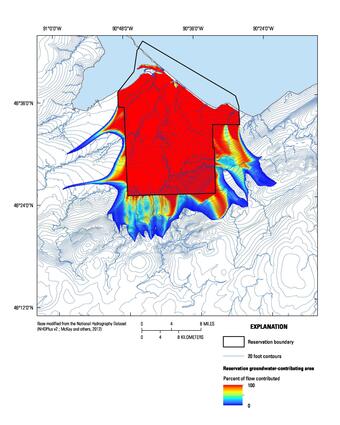
Groundwatershed
The Groundwatershed of the Bad River extends from the Penokee Range northward toward Lake Superior. The lowland areas have longer flow paths and older water than upland areas. Groundwater is likely near the surface (bright cyan color = high flow to the land surface). These areas have the high potential to have groundwater fed wetlands and trout streams, such as the streambed spring in Troutmere Creek. The groundwater model report, groundwater mapper, and groundwater Modflow model support this data.
Geomorphic monitoring – channel change
Geomorphic reference sites were established along the Bad River and key tributaries for monitoring channel changes and bank erosion. Cross sections were revisited approximately every five years. Data are in review and planned to be published in a USGS ScienceBase data release.
Fluvial erosion hazards
In response to the repeated damages to roads and culverts, a multi-agency fluvial erosion hazard screening tool was developed as a pilot for the Marengo watershed. The screening tool shows hotspots of headwater incision, latera migration, and coarse sediment deposition. The results are useful for identifying areas where natural flood management techniques might be helpful.
Bad River’s Effects on the Sloughs
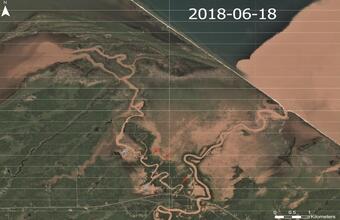
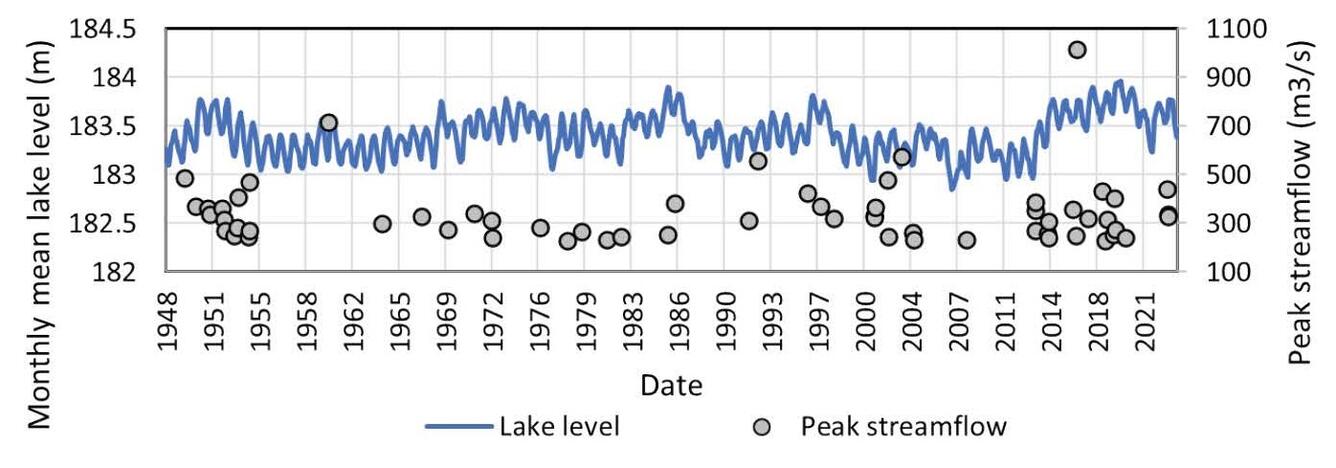
After the extreme floods in 2016 and 2018 we focused studies on effects from the extreme floods on erosion and sedimentation. Of special interest was flooding and sedimentation characteristics of the Kakagon and Bad River Sloughs and the frequency of Bad River flooding into the Kakagon River, which brings additional nutrients and sediment-rich river water to Chequamegon Bay. Based on a study conducted in 2022-24, sediment-laden high flows from the Bad River have likely made it into the Kakagon (red arrows) over 60 times in the last 75 years, including 20 floods during the most recent 10-year period. The extent of river flooding is affected by lake levels and ice jams.
River flows and Ice in the Sloughs
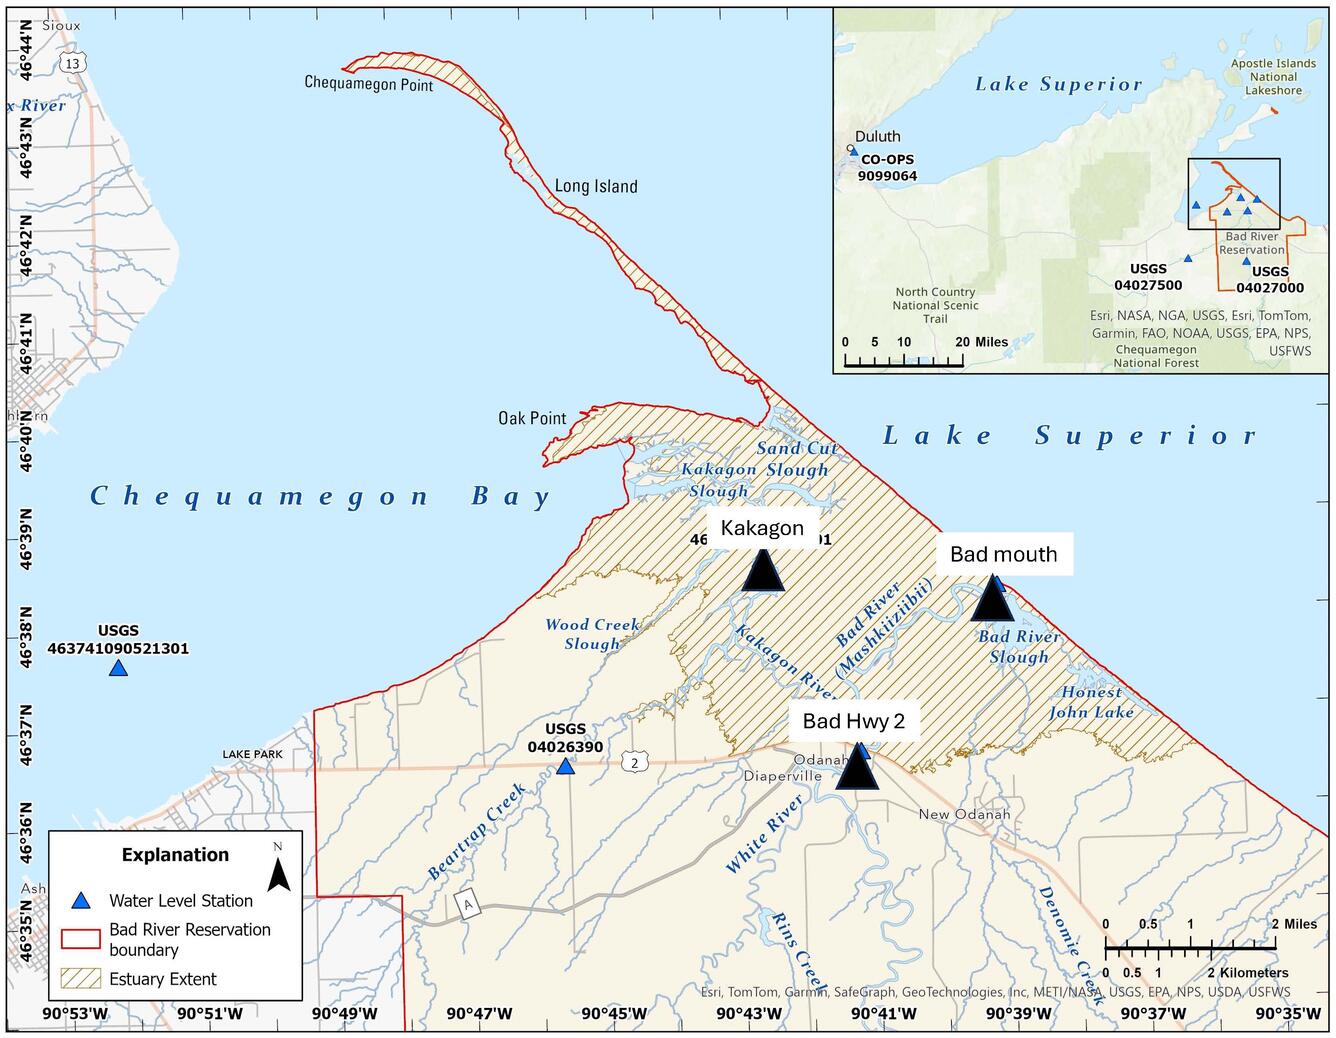
Three velocity gages in Sloughs (Bad River at the mouth, 04027655; Bad River at Hwy 2, 04027595; and Kakagon River are helping to understand how water moves through the sloughs relative to river floods, lake level fluctuations, and ice. Data are realtime and publicly available. The gages are in part funded by the Great Lakes Oil Spill Center of Excellence to aid in oil spill response planning along coastal wetlands. Locations and data are available at the USGS National Water Information System Mapper.
The Bad River has one of the highest sediment loads of all Lake Superior tributaries and is an important resource for lake sturgeon and the Bad River Tribe. This study monitors the effects of streamflow variability on sediment-related problems, including understanding the influence of land cover on hydrology, habitat, erosion and sedimentation rates, and water quality of the Bad River.
Overview
The USGS has partnered with the Mashkiiziibii Natural Resources Department (MNRD) for over 20 years on science support and monitoring related to floods, water quality assessments, geomorphic change, groundwater and groundwater/surface water interactions, oil spill planning, and mercury studies in the Bad River (Mashkiiziibii) Watershed. Our studies have direct guidance and critical collaboration by MNRD staff.
In 2025 we began a two-year study funded by the Great Lakes Restoration Initiative to integrate available hydrologic and geomorphic data and studies to create insightful linkages among groundwater/surface water interactions, floods, erosion and deposition, and eventually water quality. This diagram illustrates some of the major pathways that water in the Mashkiiziibii takes during its journey from the sky and ground sources to Lake Superior.
Problem
A historical perspective of changes in the sediment, water quality, and hydrologic conditions of the Bad River watershed is needed for environmental management and protection of the Bad River Tribe’s water resources. Previous sediment load studies conducted by the USGS identified the Bad River as having the highest sediment load of all tributaries to Lake Superior. A large, highly valued coastal wetland complex in the Kakagon and Bad River Sloughs exists at the mouth of the river and is affected by flooding and sedimentation from the Bad River. The Bad River is one of a handful of rivers that has naturally reproducing lake sturgeon.
Objectives
The objectives of the studies included in this project are varied but have a central thread of long-term monitoring of changes in streamflow and groundwater related to land use changes and meteorological variations. The main objectives of this study are to understand the historical and modern influences of land cover on hydrology, habitat, erosion/sedimentation rates, and water quality of the Bad River and its key tributaries.
Approach
All aspects of the approach are coordinated and assisted by scientists, managers, and technicians in the Mashkiiziibii Natural Resources Department. The approach began with a GIS analysis of the watershed and identification of erosion and sedimentation hotspots. Valley cross sections were surveyed and floodplain stratigraphy was used to establish historical overbank sedimentation rates. Streamflow and water quality characteristics were monitored in relation to nutrient sources, potential mining, and oil spill preparedness. Groundwater flow models were completed. Flood studies were completed after the 2016 floods. Various studies conducted by the USGS in the Bad River watershed are summarized below.
Streamflow monitoring and synoptic surveys
This map shows the location where the USGS monitors streamflow and velocity in the Mashkiiziibii watershed. In the Fall of 2024, a seepage run was conducted to track the amount of baseflow in tributaries across the watershed (flows between rain events). Many of the streams had more flow in 2024 (blue and purple dots) compared to previous study in 2011. Data are publicly available on USGS websites.
Flood studies and inundation maps
Documenting the extent of flooding is important to know relative to precipitation, human safety, and damages to infrastructure and property. MNRD staff were instrumental at documenting the high-water marks, which could be surveyed in later by USGS crews and helped determine flood inundation maps for the Bad River, Beartrap Creek, and Denomie Creek. These maps can then be used to help predict future floods with varying rainfall.
Groundwatershed
The Groundwatershed of the Bad River extends from the Penokee Range northward toward Lake Superior. The lowland areas have longer flow paths and older water than upland areas. Groundwater is likely near the surface (bright cyan color = high flow to the land surface). These areas have the high potential to have groundwater fed wetlands and trout streams, such as the streambed spring in Troutmere Creek. The groundwater model report, groundwater mapper, and groundwater Modflow model support this data.
Geomorphic monitoring – channel change
Geomorphic reference sites were established along the Bad River and key tributaries for monitoring channel changes and bank erosion. Cross sections were revisited approximately every five years. Data are in review and planned to be published in a USGS ScienceBase data release.
Fluvial erosion hazards
In response to the repeated damages to roads and culverts, a multi-agency fluvial erosion hazard screening tool was developed as a pilot for the Marengo watershed. The screening tool shows hotspots of headwater incision, latera migration, and coarse sediment deposition. The results are useful for identifying areas where natural flood management techniques might be helpful.
Bad River’s Effects on the Sloughs
After the extreme floods in 2016 and 2018 we focused studies on effects from the extreme floods on erosion and sedimentation. Of special interest was flooding and sedimentation characteristics of the Kakagon and Bad River Sloughs and the frequency of Bad River flooding into the Kakagon River, which brings additional nutrients and sediment-rich river water to Chequamegon Bay. Based on a study conducted in 2022-24, sediment-laden high flows from the Bad River have likely made it into the Kakagon (red arrows) over 60 times in the last 75 years, including 20 floods during the most recent 10-year period. The extent of river flooding is affected by lake levels and ice jams.
River flows and Ice in the Sloughs
Three velocity gages in Sloughs (Bad River at the mouth, 04027655; Bad River at Hwy 2, 04027595; and Kakagon River are helping to understand how water moves through the sloughs relative to river floods, lake level fluctuations, and ice. Data are realtime and publicly available. The gages are in part funded by the Great Lakes Oil Spill Center of Excellence to aid in oil spill response planning along coastal wetlands. Locations and data are available at the USGS National Water Information System Mapper.